
Figure 1.
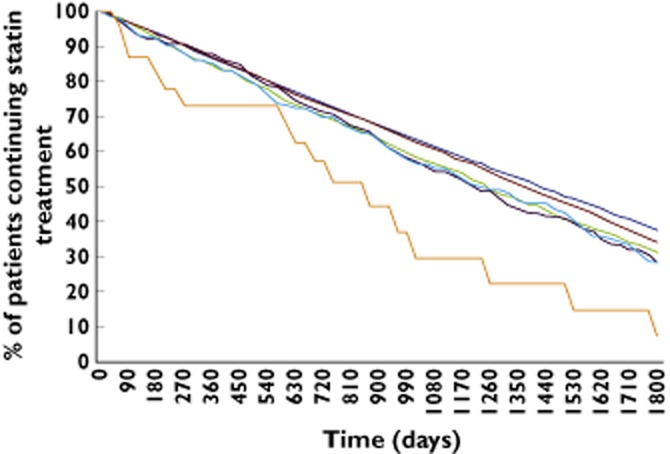
Persistence to statin treatment after the CPK measurement or rhabomyolysis. x axis: Time in days of duration of statin treatment from the first statin prescription after the CPK measurement or rhabomyolysis. y axis: Percentage of patients continuing statin treatment at a time point.  , Normal CPK;
  , one to two times ULN;
  , two to three times ULN;
  , three to four times ULN;
  , >four times ULN;
  , rhabdomyolysis