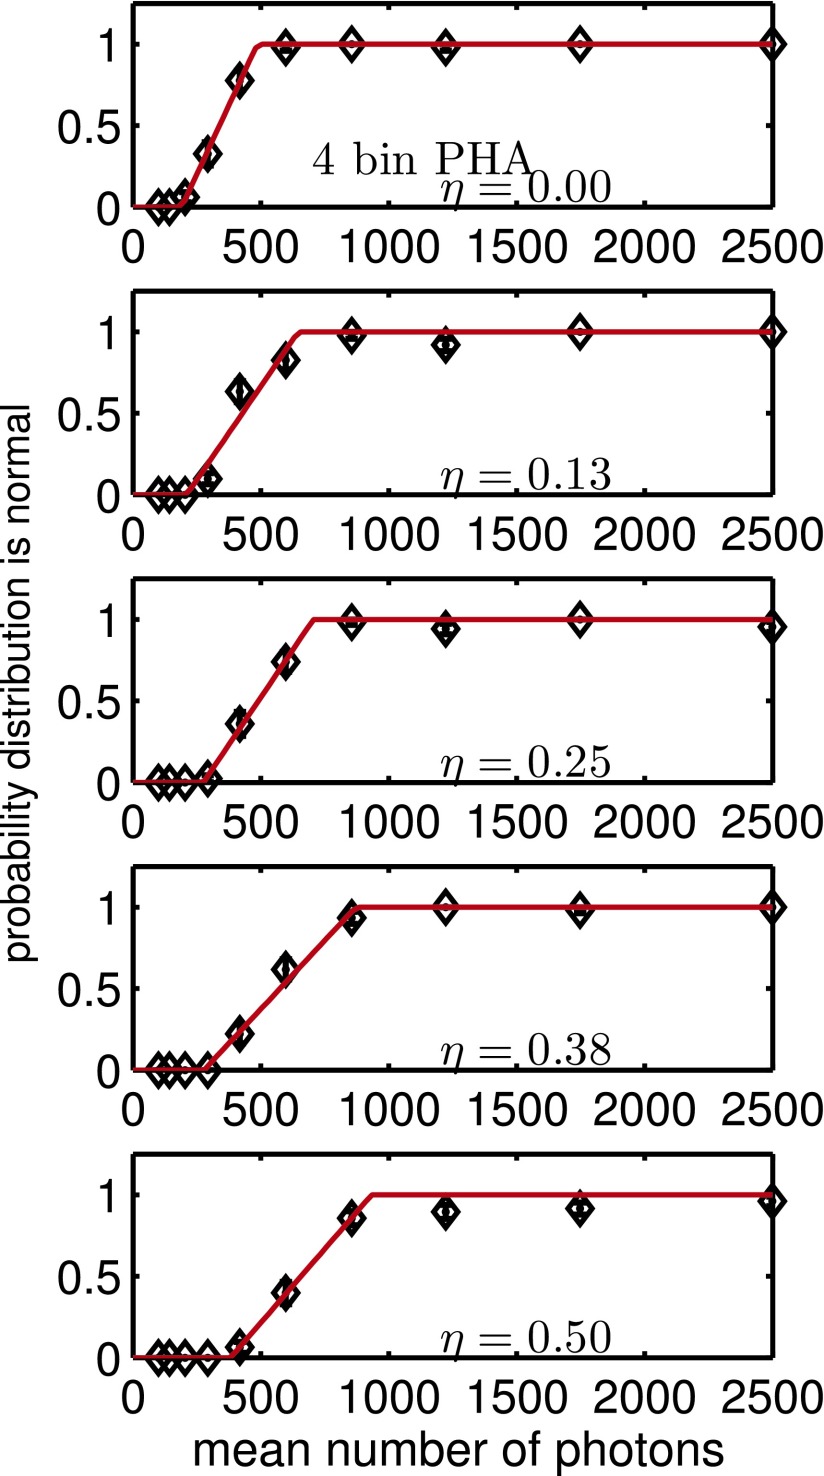
FIG. 6.
Results of tests for multivariate normal for four bin PHA data for several values of the expected incident counts per dead time parameter, η, as a function of the number of photons per measurement. The y-axis is the probability that the distribution is normal. The points are the average of five trials and the error bars are the expected error. The solid line is the best fit sigmoid curve.

