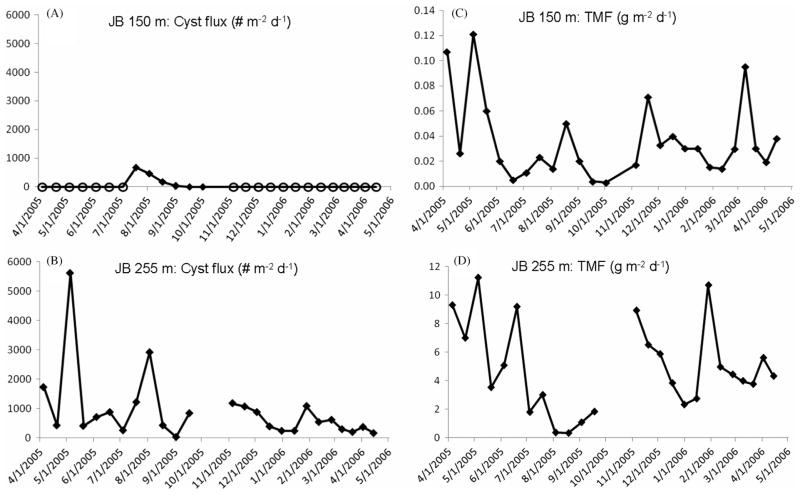
Fig. 2.
Jordan Basin site, April 2005–May 2006 cyst and total mass fluxes of particulates (TMF). (A) Cyst fluxes (# m−2 d−1) measured at 150 m and (B) at 255 m. Open circle marker symbols indicate zero cyst flux/no cysts collected in the trap cup during the particular collection period. (C) TMF measured at JB 150 m and (D) at JB 255 m, both in g m−2 d−1. Breaks in 255 m cyst and TMF plot lines indicates lost trap sample due to trap malfunction.

