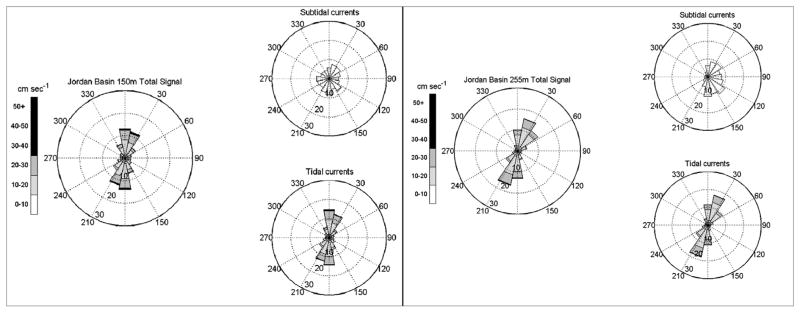
Fig. 4.

Jordan Basin mooring site current speeds and direction at 150 m and 255 m for deployment period August–May 2005. Rose diagrams present flow speeds and direction for the total flow signal, subtidal and tidal signals at each depth. Flow direction is indicated by the shaded, 22.5° slices or petals; cm s−1 flow speeds are indicated by scale bar to the left of each set of diagrams. The percentage of time measured flows fell within a specific direction and velocity bin is indicated by the annular circles of the rose diagrams.
