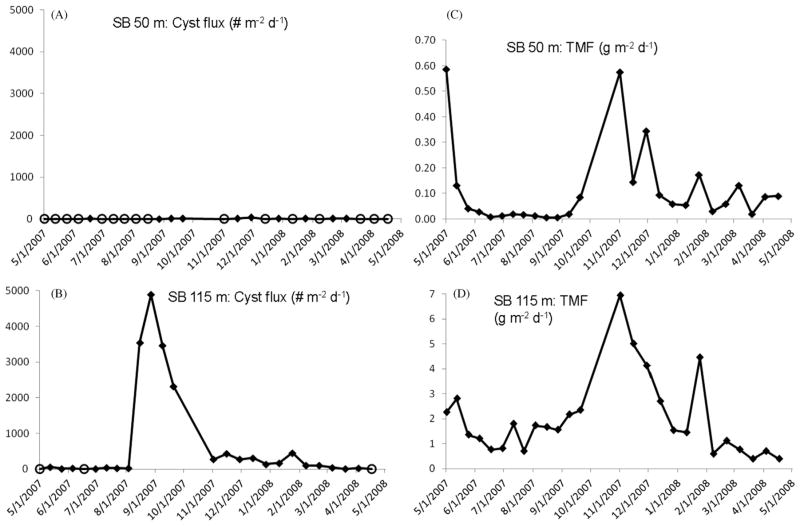
Fig. 6.
Northern Stellwagen Bank (SB) site, May 2007–May 2008 cyst and total mass fluxes of particulates (TMF). (A) Cysts fluxes (# m−2 d−1) measured at the, 50 m and (B) 115 m. Open circle marker symbols in (A) and (B) indicate zero cyst flux/no cysts collected in the trap cup during the particular collection period. Note that the range scale of cyst fluxes was 0–101 cysts m−2 d−1 at 50 m and 0–103 cysts m−2 d−1 at 115 m. (C) TMF measured at SB 50 m and (D) at SB 115 m, both in g m−2 d−1.

