
Figure 1.
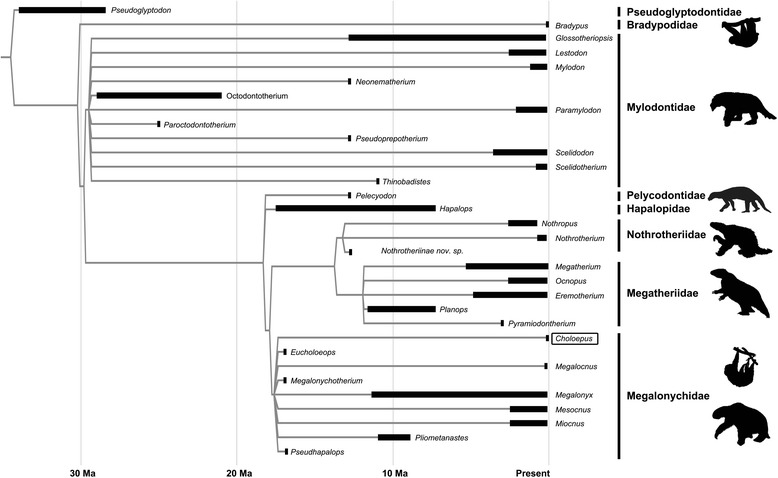
Cladogram of phylogenetic relationships among sloth genera based on recent phylogenetic analyses [ 1,5,10 ]. Branch lengths are scaled to appearance events in the fossil record for each genus, with dark bars indicating the temporal ranges in the data set (Additional file 1: Table S1). Note that most genera contain multiple species and the analyses presented here were performed at the species-level. Families are indicated on the right. The topology of this cladogram was used in the compilation of taxonomic groups for the body size analysis presented here. Silhouettes are modified from phylopic.org.