
Figure 2.
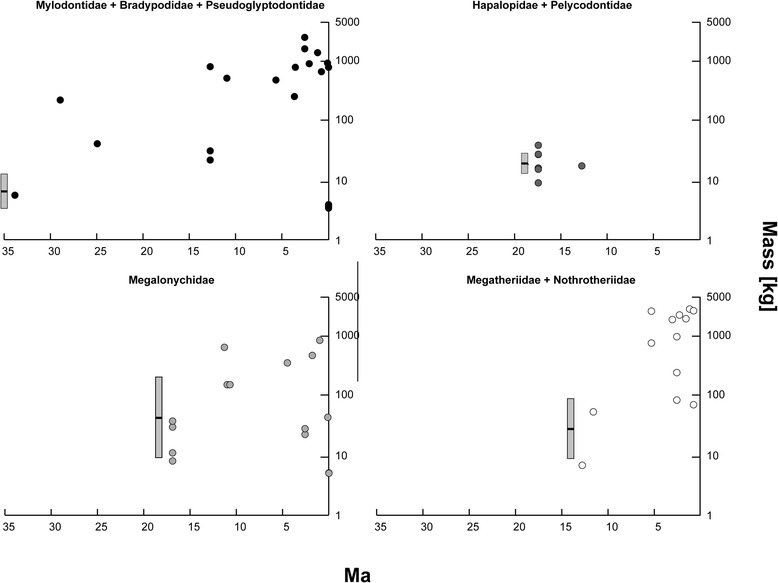
Body sizes for sloth species plotted at the FAE for each species in Additional file 1: Table S1. Species are arranged in plots as a function of the taxonomic grouping used in the analyses. The reconstructed body size distributions, based on the all-taxa, weighted-average model, are presented in the box plot just before the FAE of the oldest species in each group (black bar: ancestral mean [μ0] black bar, grey box: standard deviation [σ0 ½]).