Figure 6.
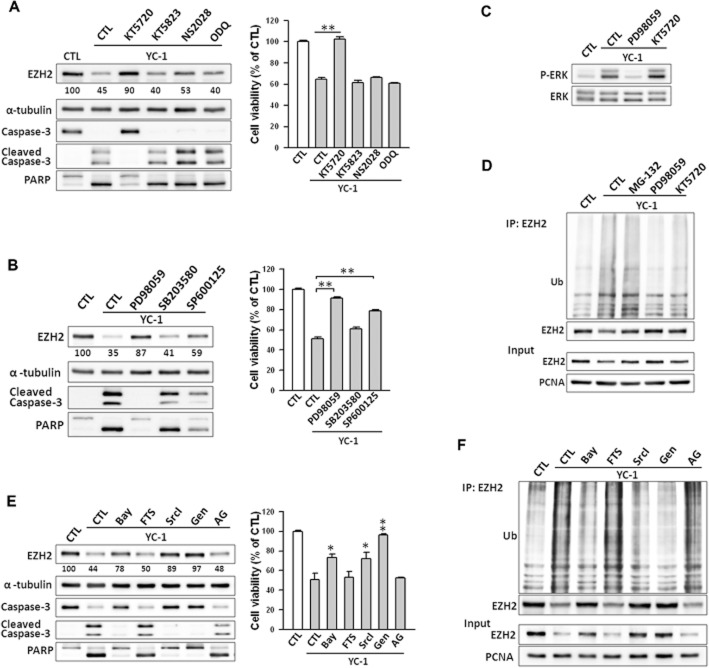
Involvement of PKA and ERK pathway in YC–1-induced EZH2 down-regulation in breast cancer cells. (A) Cells were pretreated with KT5720 (3 μM), KT5823 (3 μM), NS2028 (30 μM), or ODQ (30 μM) and then stimulated with YC-1 (3 μM) for 6 h. Cells were then collected for assessment of protein level by Western blotting (left) or viability (right). The EZH2 expression levels were quantified and are shown under the blot. (B) Cells were pre-incubated with DMSO (as control), PD98059 (10 μM), SB203580 (10 μM) or SP600125 (10 μM), followed by stimulation with 3 μM YC-1 for 6 h. Cells were collected and analysed for protein content (left) and cells viability (right). (C) Cells were induced by 3 μM YC-1 for 6 h in the presence of PD98059 or KT5720. Cells were then collected for the assessment of ERK phosphorylation by Western blotting. (D) Cells were treated with MG-132 (3 μM), PD98059 (10 μM) or KT5720 (3 μM) for 1 h before treatment with 3 μM YC-1. Six hours later, cells were harvested for the EZH2 ubiquitination assay. (E) Cells were pretreated with DMSO (as control), Bay-43–9006 (Bay, 10 μM), farnesyl thiosalicylic acid (FTS, 10 μM), Src inhibitor I (SrcI, 10 μM), and genistein (Gen, 10 μM), or AG1478 (AG, 10 μM) then incubated with YC-1 (3 μM) for 6 h. Cells were harvested and lysed for Western blotting (left) and assessment of viability (right). (F) Cells were induced by 3 μM YC-1 in the presence of the indicated inhibitors. Cells were lysed and subjected to the EZH2 ubiquitination assay. Results are expressed as mean ± SEM of three independent experiments. *P < 0.05; **P < 0.01, compared with control.

