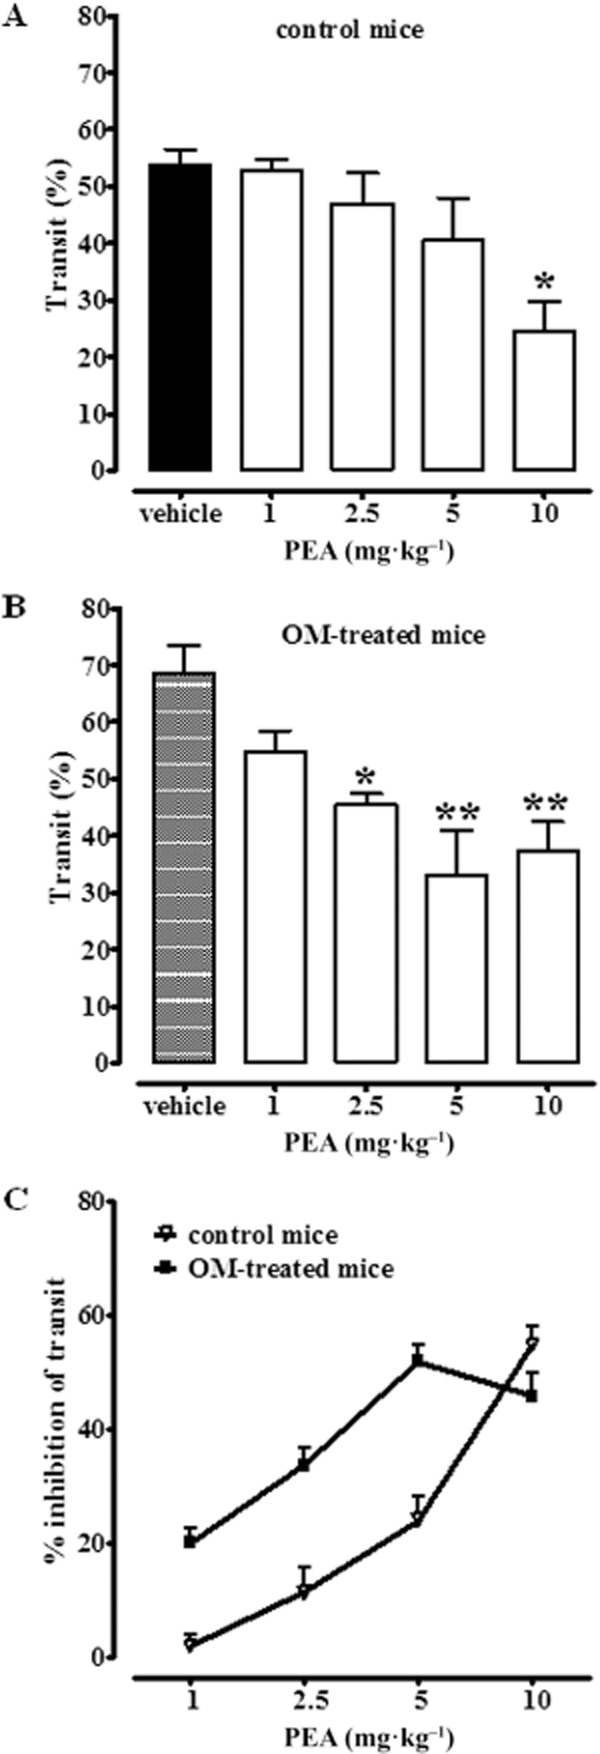
Figure 2.

Inhibitory effect of PEA (1–10 mg·kg−1, i.p.) on upper gastrointestinal transit in control mice (A) and (B) in mice treated with OM. Transit was measured 28 days after OM or vehicle (30% ethanol) administration. Results (the means ± SEM of 9–10 mice for each experimental group) are expressed as a percentage of upper gastrointestinal transit. *P < 0.05, **P < 0.01, significantly different from vehicle. In (C), the effect of PEA (1–10 mg·kg−1, i.p.) on upper gastrointestinal transit is expressed as % of inhibition of corresponding control values. A statistically significant difference (P < 0.01) was observed between the two dose-response curves shown in (C). Note that in (A) the term ‘vehicle’ refers to the vehicle used to dissolve PEA, while in (B) the term ‘vehicle’ refers to the vehicle used to dissolve OM.
