
Figure 4.
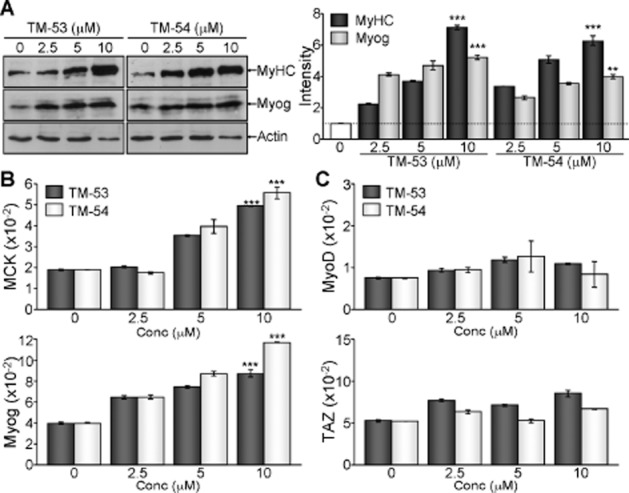
Augmentation of myogenic gene expression by treatment with TM-53 and TM-54. C2C12 myoblasts were treated with different amounts (0, 2.5, 5 and 10 μM) of TM-53 and TM-54 for 4 days during myogenic differentiation. (A) Protein extracts were resolved by SDS-PAGE, followed by immunoblotting analysis with Ab against MyHC, Myog and actin. The bands of MyHC and Myog were quantitatively analysed by densitometry. Representative immunoblotting images are shown and protein band intensity is mean ± SEM for three independent experiments after normalization to the actin level. (B, C) Total RNA was harvested using TRIzol and reverse-transcribed for quantitative real-time PCR analysis. Relative expression level of MCK and Myog (B), MyoD and TAZ (C) was determined after normalization to β-actin levels. **P < 0.005; ***P < 0.0005; significantly different from control.