
Figure 3.
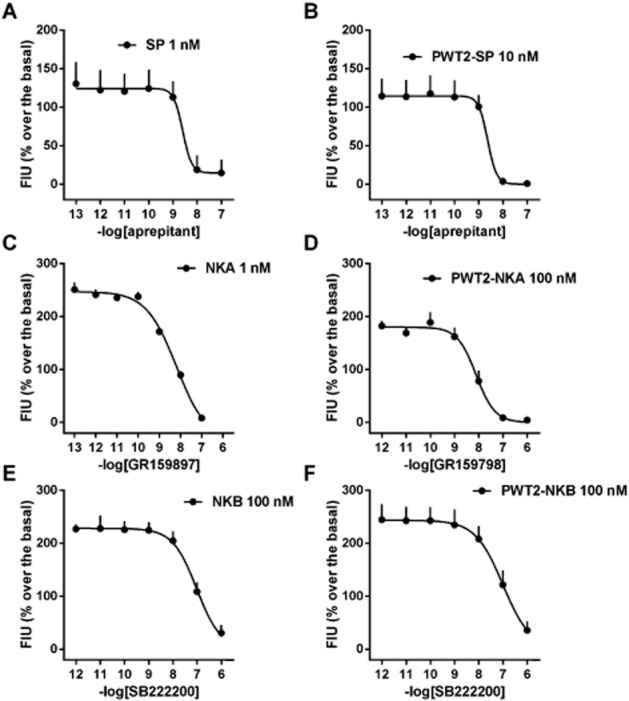
Calcium mobilization assay performed in CHO cells expressing NK1 (panels A and B), NK2 (panels C and D), and NK3 (panels E and F) receptors. Inhibition–response curve to NK receptor antagonists against the stimulatory effect of natural tachykinins (panels A, C and E) and their PWT derivatives (panels B, D and F). Data are mean ± SEM of four experiments performed in duplicate.