
Figure 8.
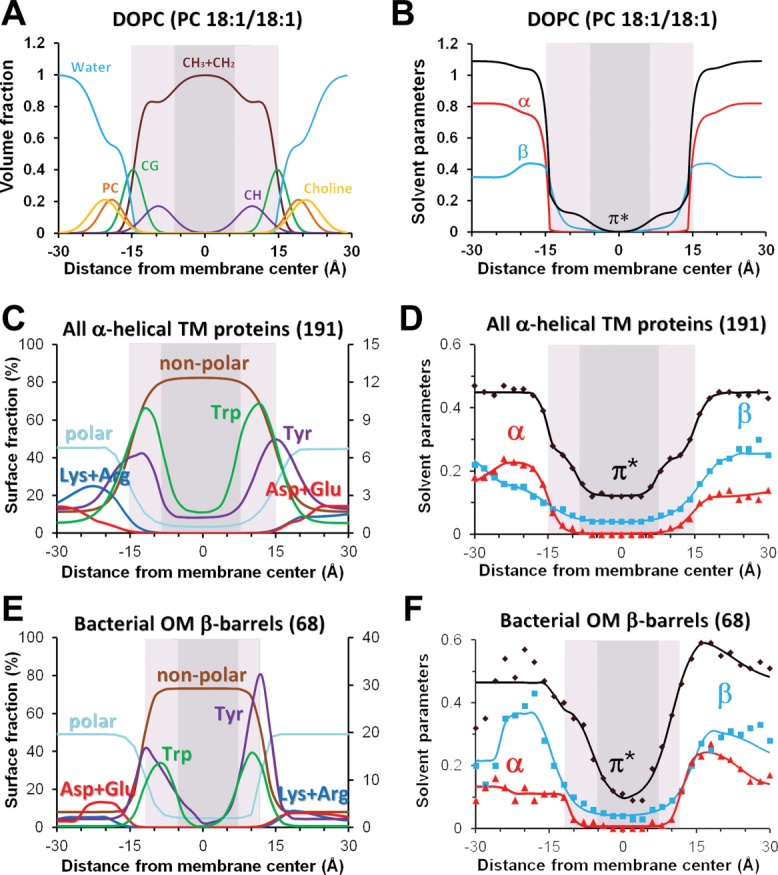
Distributions of chemical groups and polarity profiles in artificial lipid bilayers (A, B) and at the lipid-facing surfaces of TM proteins (C-F). (A) Volume fractions of lipid segments determined by X-ray and neutron scattering for fluid DOPC membrane.324 (B) Profiles of hydrogen-bonding donor (α) and acceptor (β) capacities and dipolarity/polarizability parameter (π*) calculated for DOPC bilayers.19 (C, E) Distribution of lipid-facing atoms in structures of 191 TM α-helical proteins from all membranes (C) and 68 OM β-barrels (E): polar atoms (N- and O-atoms) of all residues, non-polar atoms (C- and S- atoms of Val, Leu, Ile, Met, Cys, Phe, Tyr, and Trp), aromatic atoms and C-atoms from benzene ring of Tyr and indole ring of Trp, charged groups of Asp/Glu and Arg/Lys. (D, F). Transbilayer profiles of polarity parameters (α, β, and π*) were calculated for lipid-facing atoms on surface of TM α-helical (D) and OM β-barrel proteins (F) (see Ref.20 for details). Midpolar regions (colored light gray) were mapped as area of preferential accumulation of Trp indole rings in TM proteins (C–F), and based on locations lipid double bond in artificial bilayers (A,B). Central hydrophobic regions are colored dark gray.