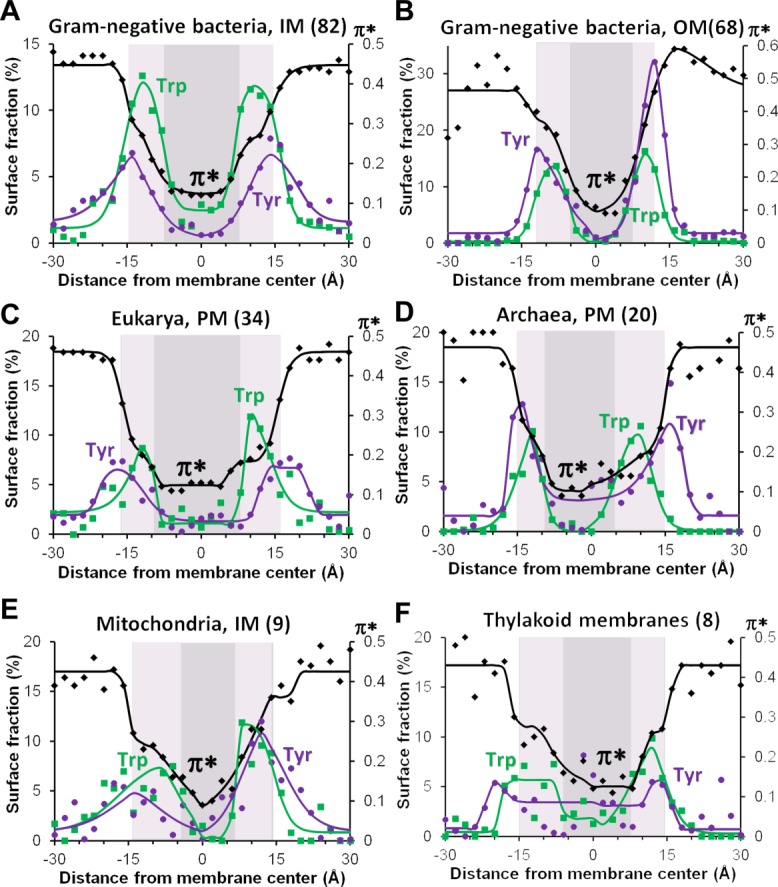
Figure 9.

Comparison of surface polarity in TM proteins from different biological membranes: IM (A) and OM (B) of Gram-negative bacteria, PM of eukaryotic (C) and archaebacterial (D) cells, mitochondrial inner membranes (E) and thylakoid membranes (F). Transbilayers distributions of aromatic and C-atoms of benzene ring of Tyr (purple lines and dots) and indole ring of Trp (green lines and squares) are compared with profiles of dipolarity/polarizability parameter π* (black lines and diamonds) calculated from distributions of all solvent-exposed atoms in proteins from different membranes. Numbers of structures in each protein set are indicated in parenthesis. Midpolar regions mapped by the preferential accumulation of Trp indole rings are colored light gray, central hydrophobic regions are colored dark gray (see the set of proteins and details of calculations in Ref.20).
