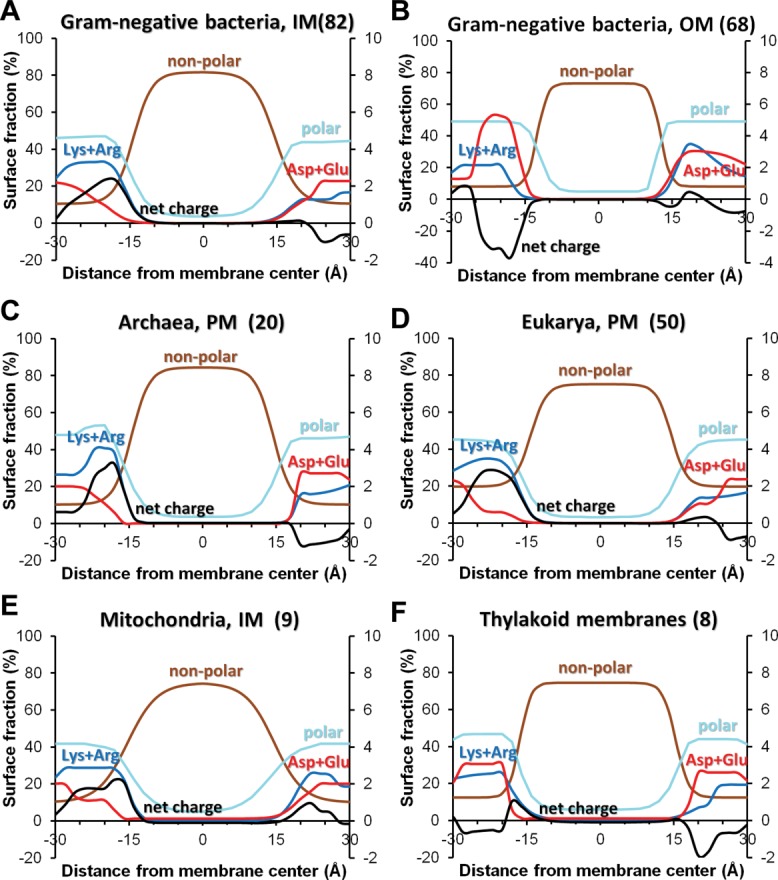
Figure 10.

Distribution of lipid-facing atomic groups and charges in TM proteins from different biological membranes: IM (A) and OM (B) of Gram-negative bacteria, PM of archaebacterial (C) and eukaryotic (D) cells, mitochondrial inner membranes (E) and thylakoid membrane (F). Distribution of polar atoms (N- and O-atoms) of all residues are shown by light blue lines, non-polar atoms (C- and S- atoms of Val, Leu, Ile, Met, Cys, Phe, Tyr, and Trp) are shown by brown lines, positively charged groups of Arg and Lys are shown by blue lines, negatively charged groups of Asp and are shown by red lines, net charges are shown by black lines. Numbers of structures in each protein set are indicated in parenthesis (see the set of proteins and details of calculations in Ref.20).
