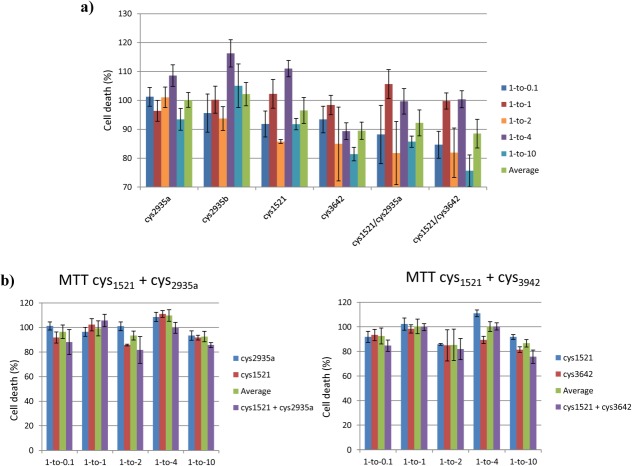
Figure 6.
Shown are a) the results from the MTT toxicity assay using Aβ42 and selected inhibitors using different molar ratios after 24 h of incubation with PC12 cells. The assay was performed with 10 μM Aβ42 and different concentrations of inhibitor, for example, 1:0.1 (1 μM), 1:1 (10 μM), 1:4 (40 μM), 1:10 (100 μM). b) a comparison of the MTT results for individual peptides against those used in combination. All errors are expressed as the standard error of the mean.

