
Figure 3.
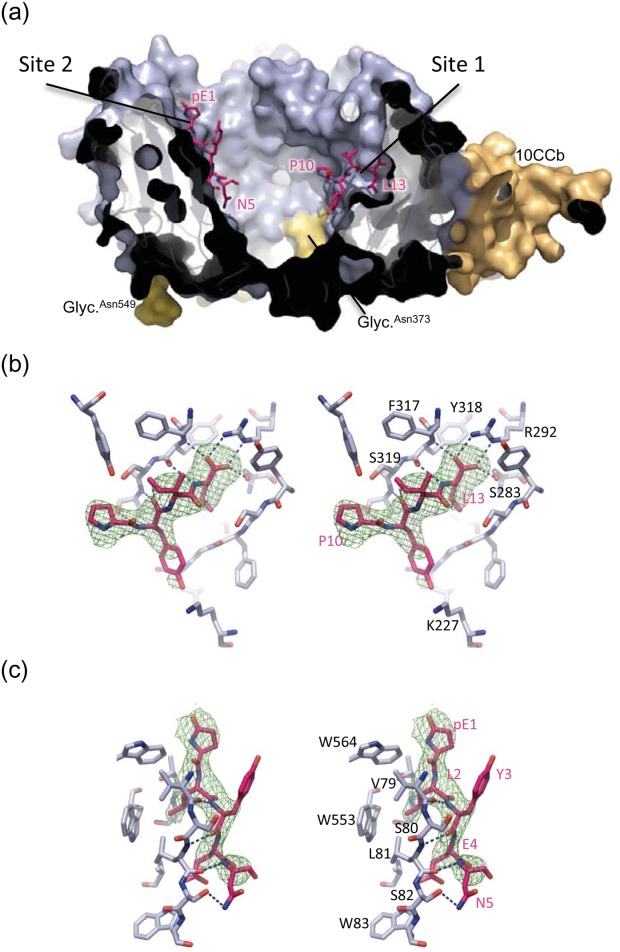
Neurotensin binding sites. (a) Cross-section of sSort:NTHigh shown in surface representation. The propeller domain is blue, 10CC-a is green (hardly visible in this view), 10CC-b is orange, the glycosylations are yellow and labelled, and NT is shown in pink sticks. (b) Stereo image of NT in binding site 1 of sSort:NTHigh. Sortilin residues within 4 Å of the bound NT are shown. Dashed lines indicate positions of hydrogen bonds, i.e., distances shorter than 3.2 Å, and the green wire mesh represents the SA-omit map of NT contoured at 3σ. Labels of selected residues of sortilin and NT are shown in black and pink respectively (c) Stereo image of NT in binding site 2 of sSort:NTHigh. Hydrogens bonds, SA-omit map and labels are shown as in panel b.