
Figure 5.
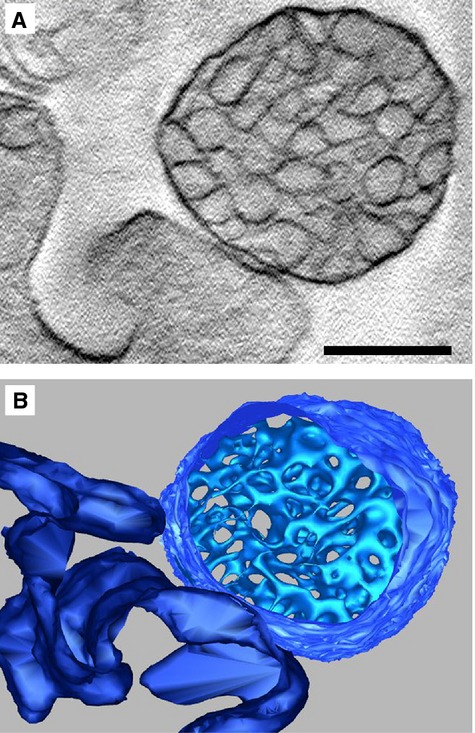
Electron tomography of multivesicular cargos (MVC): (A) Central tomogram section of a MVC, in direct contact with the cell membrane, revealing clustered vesicles enclosed by a membrane; (B) 3D model of section shown in (A) with isosurface representation of contained vesicles, revealing dense packaging. Cell membrane shown in dark blue. Scale bar represents 400 nm.