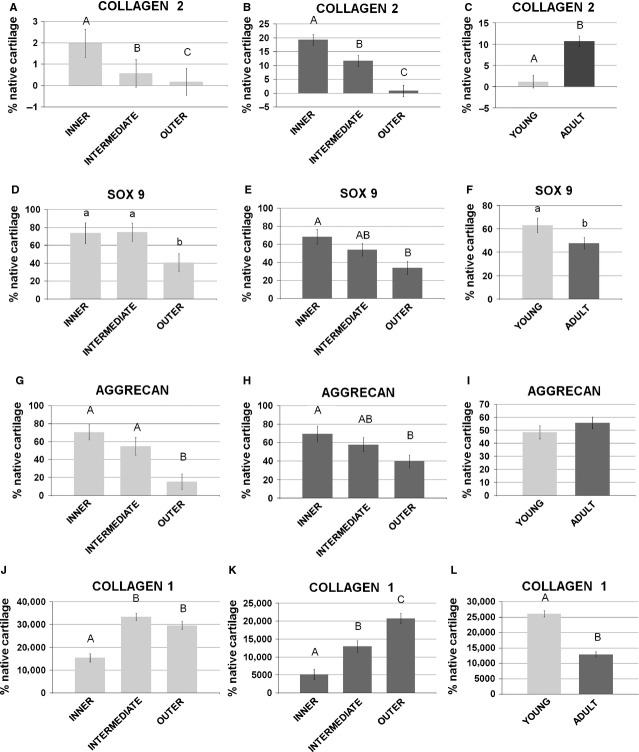
Figure 6.
Gene expression analysis by real-time PCR. Comparison of collagen 2 (A and B), Sox9 (D and E), aggrecan (G and H) and collagen 1 (L and M) among the inner, the intermediate and the outer areas of the menisci: (A,D,G,L) young model; (B,E,H,M) adult model. Comparison of collagen 2 (C), Sox9 (F), aggrecan (I) and collagen 1 (N) between the young and the adult samples. Values with different superscripts differ for P < 0.05 (a,b) or P < 0.01 (A,B). N/group = 8.

