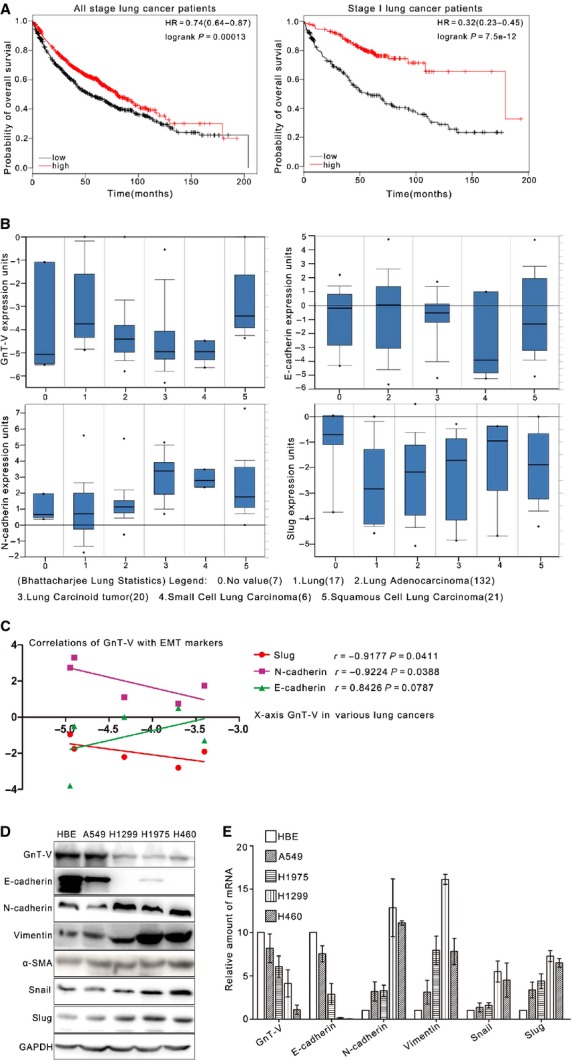
Figure 1.

High GnT-V expression is correlated with good prognosis and negatively correlated with EMT in human lung cancer. (A) Correlation between higher GnT-V (Affymetrix ID: 212098-at) expression and good overall survival (OS) in all stage (n = 1406; left) or stage I (n = 440; right) lung cancer patients. Plots were generated online by using a Kaplan–Meier Plotter based on signal intensity in microarray gene expression data from patients for whom OS data are available (www.kmplot.com/lung). Upper curve, red, indicates higher than median expression, and lower curve, black, lower than median expression. (B) Oncomine box plot RNA expression data for GnT-V and EMT markers (E-cadherin, N-cadherin and Slug) in normal tissue compared with cancer were shown within the Bhattacharjee lung database of publicly available Oncomine microarray data sets (www.oncomine.org). The log2 median-centred ratios for gene expression level are depicted in box-and-whisker plots. Dots represent maximum and minimum outliers from the main data set. For each plot, the following pathological subtypes were evaluated separately. 0, No value (n = 7); 1, Lung (n = 17); 2, Lung adenocarcinoma (n = 132); 3, Lung carcinoid tumour (n = 20); 4, Small cell lung carcinoma (n = 6); 5, Squamous cell lung carcinoma (n = 21). (C) Correlations between GnT-V and EMT markers' (E-cadherin, N-cadherin and Slug) expression in human lung cancer were analysed by using Bhattacharjee lung database of publicly available Oncomine microarray data sets (www.oncomine.org). (D and E) Protein (D) and mRNA (E) expression of GnT-V and EMT markers (E-cadherin, N-cadherin, Vimentin, α-SMA, Snail and Slug) in human normal lung cell line HBE and lung cancer cell lines, including A549, H1299, H1945 and H460, was determined by western blot and qRT-PCR respectively.
