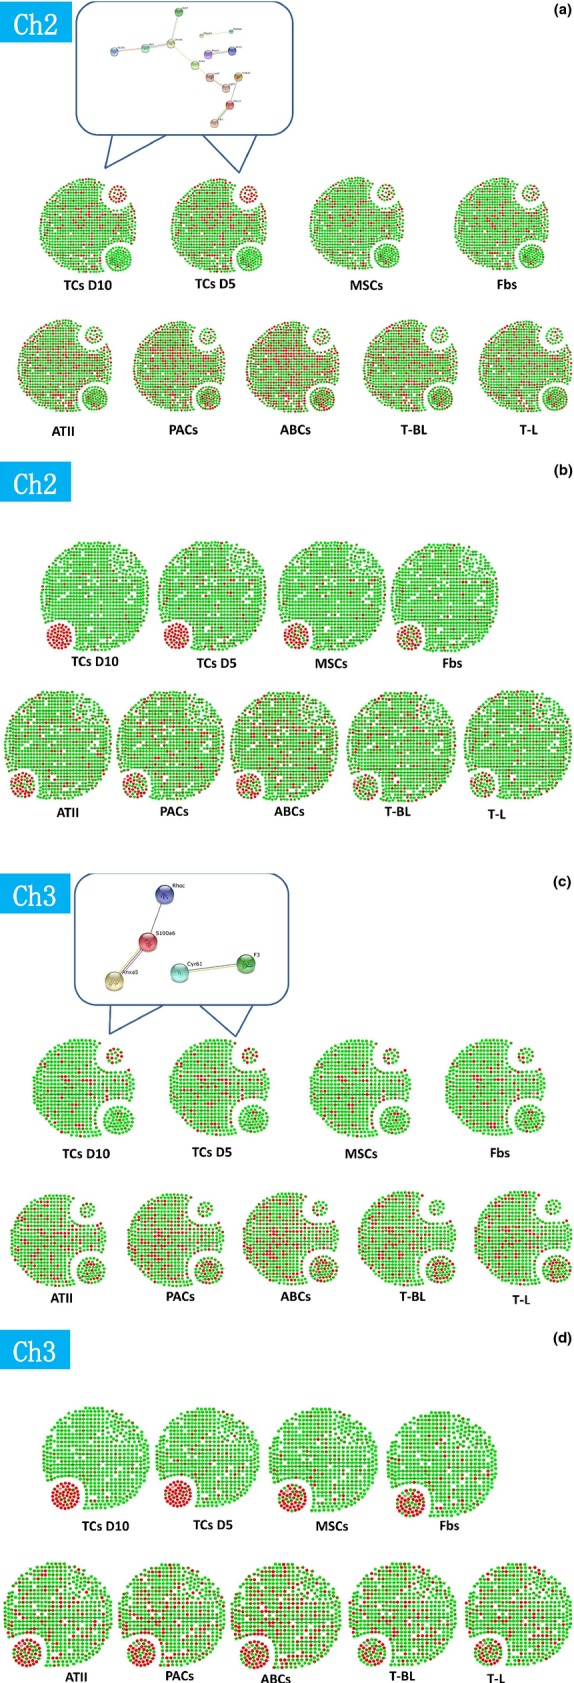
Figure 1.

Expression profiles of the selected genes as an active group of chromosome 2 and 3 of TCs (TCs) isolated and cultured from mouse lungs on days 5 (D5) and 10 (D10), as compared with fibroblasts (Fbs), mesenchymal stem cells (MSCs), alveolar type II cells (ATII), airway basal cells (ABCs), proximal airway cells (PACs), CD8+ T cells come from bronchial lymph nodes (T-BL), and CD8+ T cells from lung (T-L) respectively (A and C). The profiles for entire genes are described in Data S1. The selected core network and whole mouse network are linked by the documented functional interactions from various databases (see Methods). Genes in each network are indicated in red and some of their nearest neighbours are indicated by dark grey nodes. A group of telocyte genes up-regulated and down-regulated more than 0-fold as compared with all other cells and existed in TCs on days 5 and 10 were selected as telocyte-specific or dominated genes in chromosome 2 and 3 (A and C). Top 50 up-or down-regulated genes of each cells were also evaluated and their distribution within chromosome 2 and 3 genes showed the difference between cells (B and D). Details of the selected network in each cell type are in Figure S1–S18.
