
Figure 2.
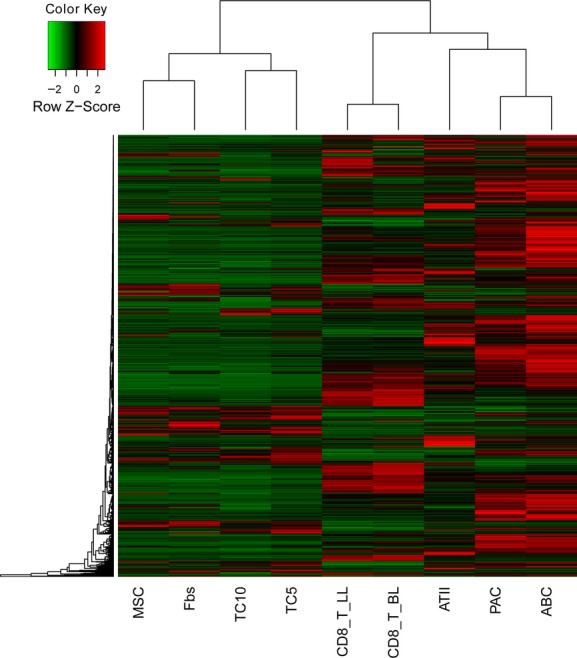
Hierarchical cluster analysis of the differentially expressed genes on chromosomes 2 and 3 among telocytes (TCs), mesenchymal stem cells (MSCs), fibroblasts (Fbs), lymphocytes from lungs (T-LL) and from bronchial lymph nodes (T-BL), alveolar type II cells (ATII), proximal airway cells (PAC) and airway basal cells (ABC).