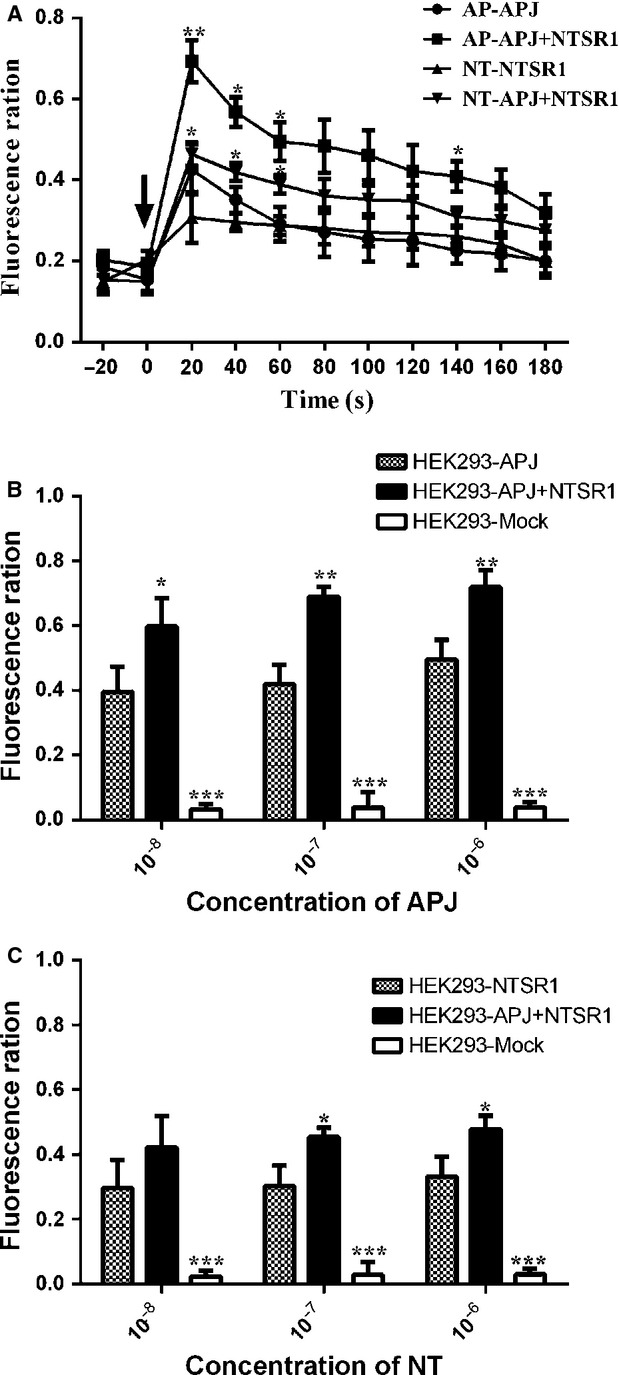
Figure 10.

The effects of co-expression of APJ and NTSR1 on intracellular Ca2 + . HEK293 cells expressing APJ, NTSR1 or APJ with NTSR1 cells were plated in a poly-d-lysine coated 96-well plate, incubated overnight, and assayed for a calcium response to apelin-13 or NT using the Fluo-4 Direct™ assay. Calcium fluorescence responses kinetics for apelin-13 or NT stimulation was expressed in terms of fluorescent change over background (A). Arrows mark the time of compound addition. (A) Each fluorescent trace represents the calcium response resulting from a dose of a single concentration (10−7 M) of apelin-13 or NT added to a single well. The maxima of time periods (0–180 sec.) of each trace were used dose–response curve construction for apelin-13 (B) or NT (C) responses, respectively. Data represented as mean ± SEM of three measurements from three independent experiments. *P < 0.05, ***P < 0.01, ***P < 0.001 compared to single transfected groups.
