
Figure 7. Relation between neurophysiology and behavior.
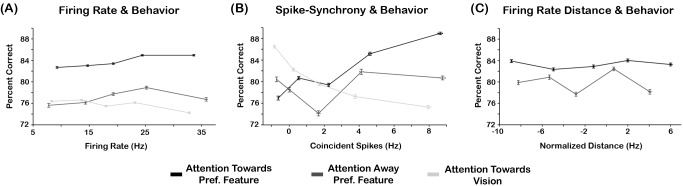
(A) Percent correct as a function of the mean FR between neural pairs. The individual traces represent the percent correct for the “attention towards the preferred feature” (solid black trace), “attention away from the preferred feature” (dashed dark-gray trace), and “attention towards vision” (dashed light-gray trace). (B) Percent correct as a function of spike-synchrony. The individual traces are illustrated in the same convention as above. (C) Percent correct as a function of normalized FR distance. The individual traces are illustrated in the same convention as above. We employed “attend towards vision” as a reference for the proximity values of attention “towards” and “away” from the preferred feature. Thus, the relationship between behavior and distance for “attend towards vision” was not computed. The horizontal and vertical error bars represent the SEMwithin. All data were derived from feature selective neural pairs only. The underlying data used to make this figure can be found in Data S1.