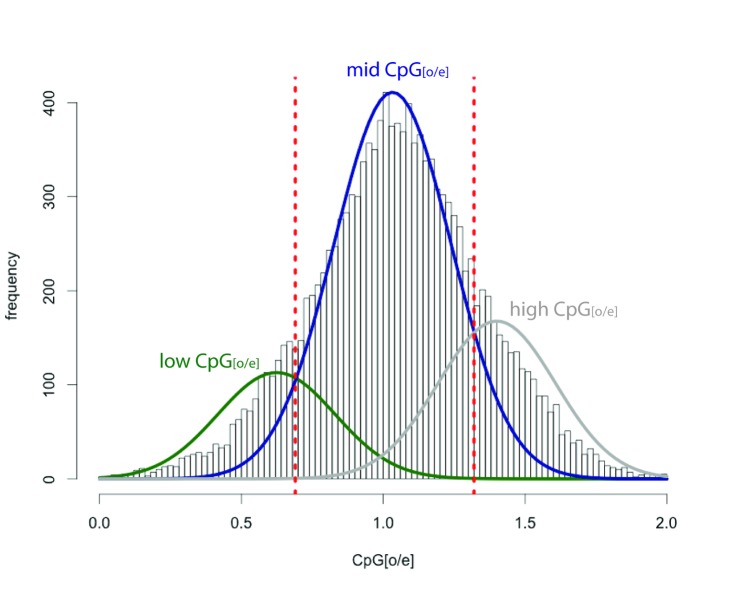
Figure 9. Frequency histogram of CpG(o/e) observed in S. maritima gene bodies.
The y-axis depicts the number of genes with the specific CpG(o/e) values given on the x-axis. The distribution of CpG(o/e) in S. maritima is a trimodal distribution, with a low-CpG(o/e) peak consistent with the presence of historical DNA methylation in S. maritima and the presence of a high CpG(o/e) peak. The data underlying this plot are available in File S4.

