Figure 2.

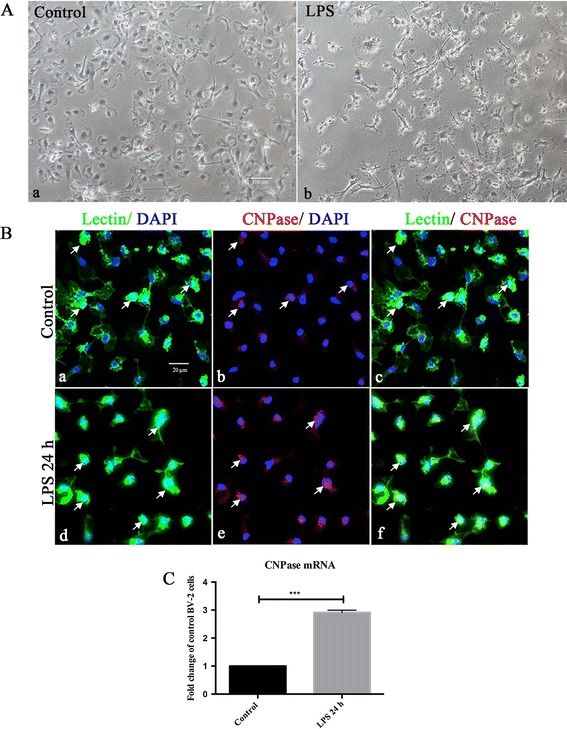
CNPase expression was increased in primary cultured microglia following lipopolysaccharide treatment. (A) Note the change in external morphology of primary microglial cells bearing long extending and stout processes after lipopolysaccharide (LPS) treatment (Ab) in comparison with the control (Aa) under the phase contrast microscope. (B) Confocal images showing CNPase expression (Bb, Be; red) in primary microglia labeled with lectin (Ba, Bd; green) and DAPI (blue) in both control and LPS treatment for 24 hours. CNPase immunofluorescence intensity is enhanced after LPS treatment (Bf) in comparison with the control (Bc). (C) CNPase mRNA expression in control and LPS activated primary microglia. LPS stimulated primary microglial cells show a significant upregulation of CNPase mRNA in comparison with the control cells. ***P < 0.001. The values represent the mean ± SD in triplicate. Scale bars = 100 μm (A) and 20 μm (B). CNPase, 2′,3′-cyclic nucleotide 3′-phosphodiesterase; DAPI, 4′,6- diamidino-2-phenylindole.
