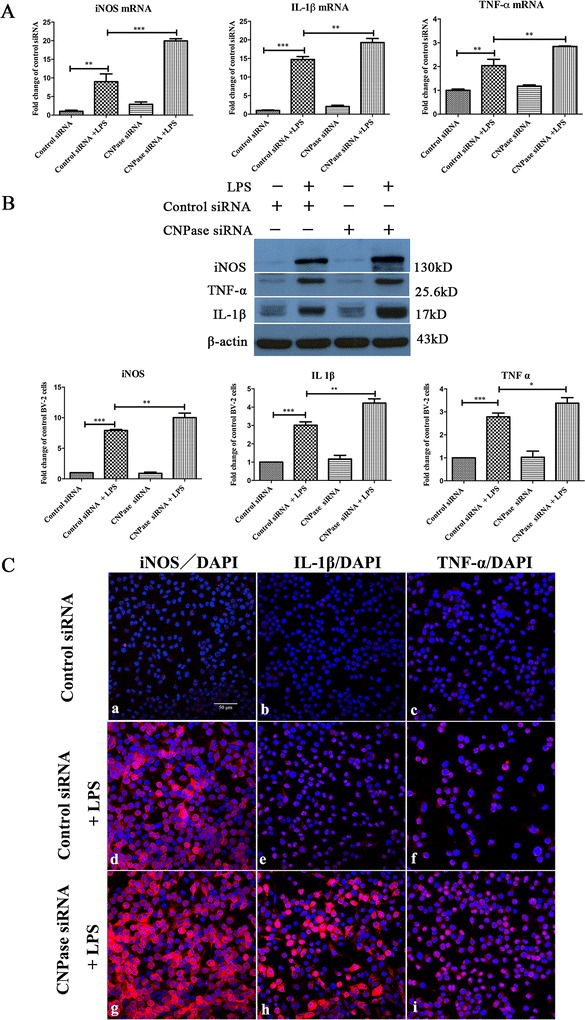
Figure 5.

CNPase knockdown increased inducible nitric oxide synthesis, IL-1β and TNF-α expression induced by lipopolysaccharide in BV-2 cells. (A) Reverse transcription polymerase chain reaction analysis of iNOS, IL-1β and TNF-α gene expression in BV-2 cells transfected with control small interfering RNA (siRNA), transfected with control siRNA + lipopolysaccharide (LPS), and transfected with CNPase siRNA and CNPase siRNA + LPS. Note that iNOS, IL-1β and TNF-α mRNA expression is increased by different amounts, respectively, after LPS treatment in control siRNA transfected BV-2 (normalized with β-actin), but the increase was significantly higher in LPS stimulated CNPase siRNA transfected BV-2 cells compared with control siRNA transfected BV-2 cells exposed to LPS stimulation. (B) iNOS, IL-1β and TNF-α protein expression in different groups of BV-2 cells given LPS treatments. The upper panel shows specific bands of iNOS, IL-1β ,TNF-α and β-actin. The lower panel of the bar graphs shows significant changes in the optical density following LPS treatment (given as fold-change of control siRNA transfected group). iNOS, IL-1β and TNF-α protein expression is significantly increased after LPS treatment in control siRNA transfected BV-2 cells and the increase is further augmented after LPS stimulation in CNPase transfected groups. (C) Immunofluorescence images show iNOS, IL-1β and TNF-α immunoreactivity is markedly increased in CNPase siRNA transfected BV-2 cells subjected to LPS treatment compared to cells transfected with control siRNA followed by LPS treatment. *P < 0.05 and **P < 0.01. The values represent the mean ± SD in triplicate. Scale bar = 50 μm (C) . CNPase, 2′,3′-cyclic nucleotide 3′-phosphodiesterase; IL-1β, interleukin-1 beta; iNOS, inducible nitric oxide synthase; TNF, tumor necrosis factor alpha.
