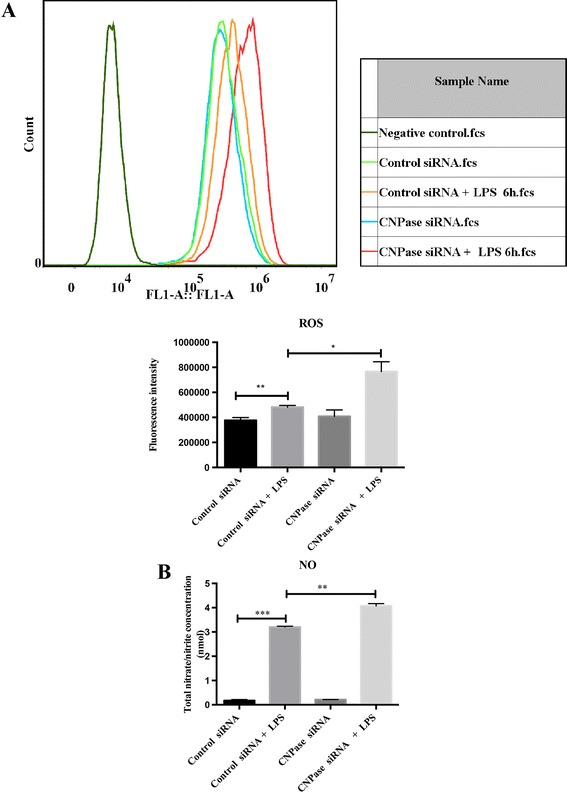
Figure 6.

CNPase knock down increased the production of reactive oxygen species and nitric oxide induced by lipopolysaccharide stimulation in BV-2 cells. (A) Intracellular reactive oxygen species (ROS) and production of nitric oxide (NO) in BV-2 cells transfected with control small interfering RNA (siRNA), control siRNA + lipopolysaccharide (LPS) 6 hours, and transfected with CNPase siRNA and CNPase siRNA + LPS 6 hours. (A) The upper panel shows cell counts (y-axis) and log10 expression of fluorescence intensity (x-axis). The lower panel is a bar graph showing a significant change in the fluorescence intensity of intracellular ROS production following the various treatments. Note that the increase of ROS production in CNPase siRNA transfected BV-2 cells with LPS treatment is higher than that in control siRNA transfected BV-2 cells with LPS stimulation. (B) NO production in supernatant shows a similar change as with ROS in the different groups mentioned above. *P < 0.05, **P < 0.01 and ***P < 0.001. The values represent the mean ± SD in triplicate. CNPase, 2′,3′-cyclic nucleotide 3′-phosphodiesterase; fcs, fluorescence-activated cell sorting.
