Figure 11.

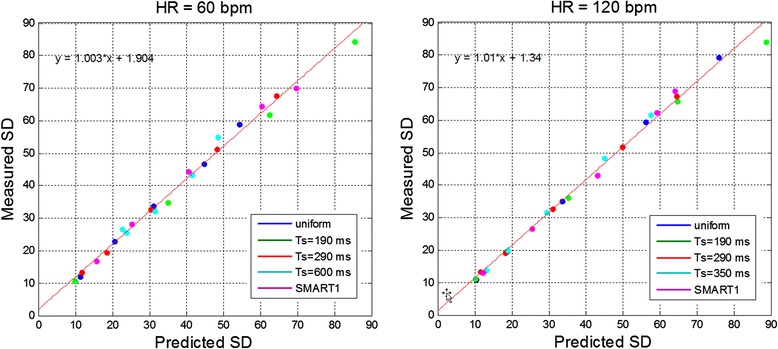
Scatter plots of measured versus predicted SD for phantom ROIs at HR = 60 bpm (left) and 120 bpm (right). Measurements plotted for 5T1-tubes with each of 5 protocols (Figure 10), with fit to all of the measured data (red line).

Scatter plots of measured versus predicted SD for phantom ROIs at HR = 60 bpm (left) and 120 bpm (right). Measurements plotted for 5T1-tubes with each of 5 protocols (Figure 10), with fit to all of the measured data (red line).