Figure 14.

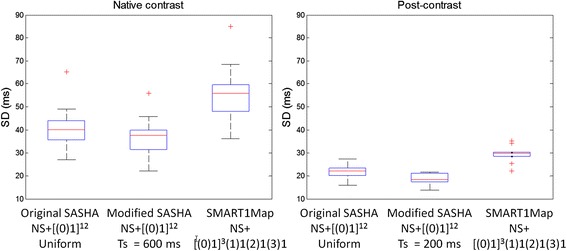
Box and whisker plots of SD values (n = 10) in septal ROI comparing the 3 protocols for native contrast (left) and post-contrast (right). Blue box represents interquartile range (IQR) with redline indicating the median.

Box and whisker plots of SD values (n = 10) in septal ROI comparing the 3 protocols for native contrast (left) and post-contrast (right). Blue box represents interquartile range (IQR) with redline indicating the median.