
Figure 14.
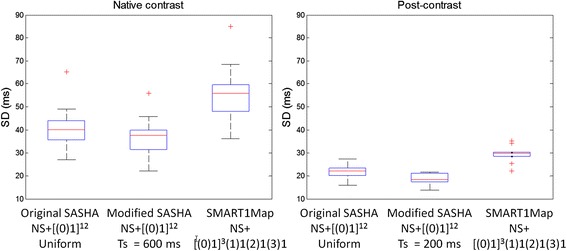
Box and whisker plots of SD values (n = 10) in septal ROI comparing the 3 protocols for native contrast (left) and post-contrast (right). Blue box represents interquartile range (IQR) with redline indicating the median.
Official websites use .gov
A
.gov website belongs to an official
government organization in the United States.
Secure .gov websites use HTTPS
A lock (
) or https:// means you've safely
connected to the .gov website. Share sensitive
information only on official, secure websites.
Box and whisker plots of SD values (n = 10) in septal ROI comparing the 3 protocols for native contrast (left) and post-contrast (right). Blue box represents interquartile range (IQR) with redline indicating the median.