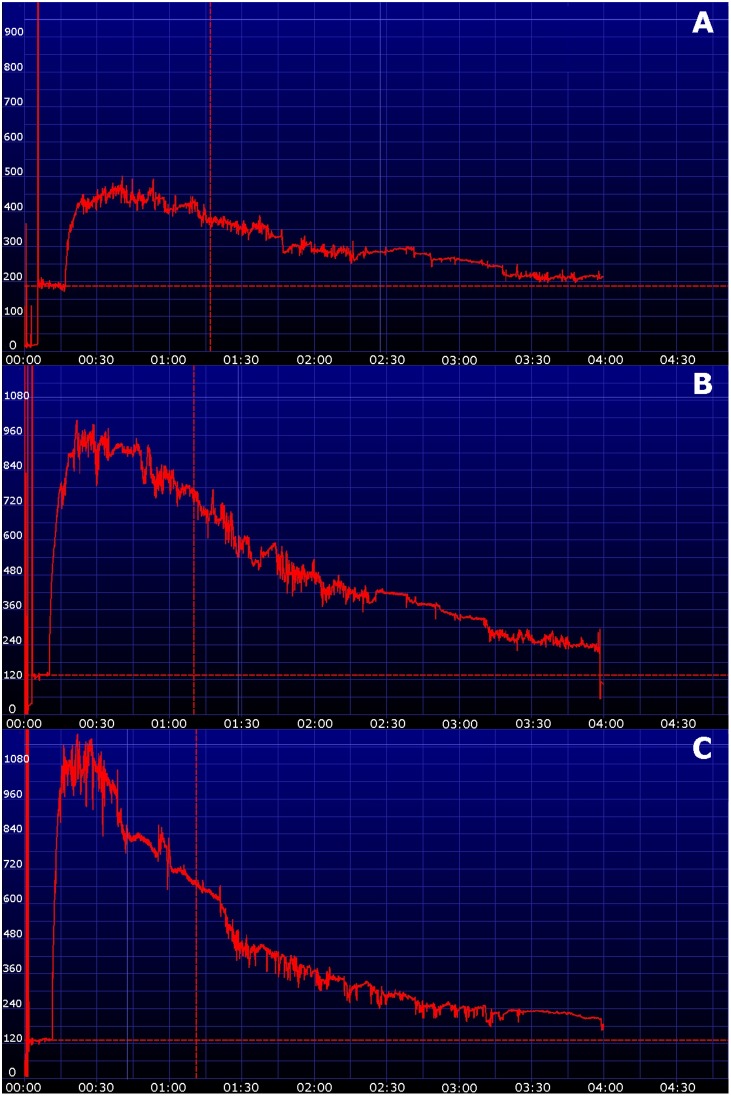
Figure 3. Transcutaneous disappearance curves of a cat using three different dosages of fluorescein-isothiocyanate-labelled sinistrin (A: 10 mg/kg, B: 30 mg/kg, C: 50 mg/kg).
The x-axis represents time, the y-axis represents the relative transcutaneous fluorescence. The dose of 30 mg/kg (B) results in an adequate peak concentration.

