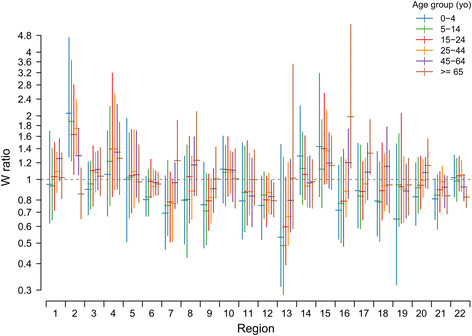
Figure 2.

Relative number of consultations per GP compared to SGP (weight ratioW) according to region, week, and age group. Each bar shows the mean 2.5 and 97.5 quantiles of the distribution of weekly weight ratios over the two-year period (2009 week 32 to 2011 week 30).
