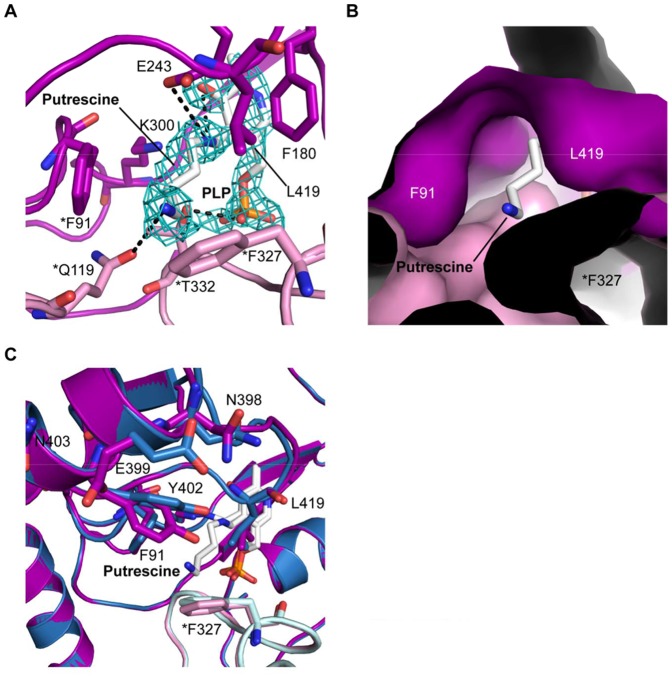
Figure 4. Putrescine binding to YgjG.
(A) The 2F o–F c electron density map is contoured at 1 sigma. The putrescine, PLP and active-site residues are represented as stick models. The hydrogen bonds are shown as dashed lines. (B) Surface representation of the substrate-binding cleft. Phe91, Leu419 and Phe327* occupy a large portion of the substrate-binding site entrance in YgjG. (C) Superposition of free YgjG and YgjG-putrescine complex. The side-chain movement of Tyr402 partially covers the active site.

