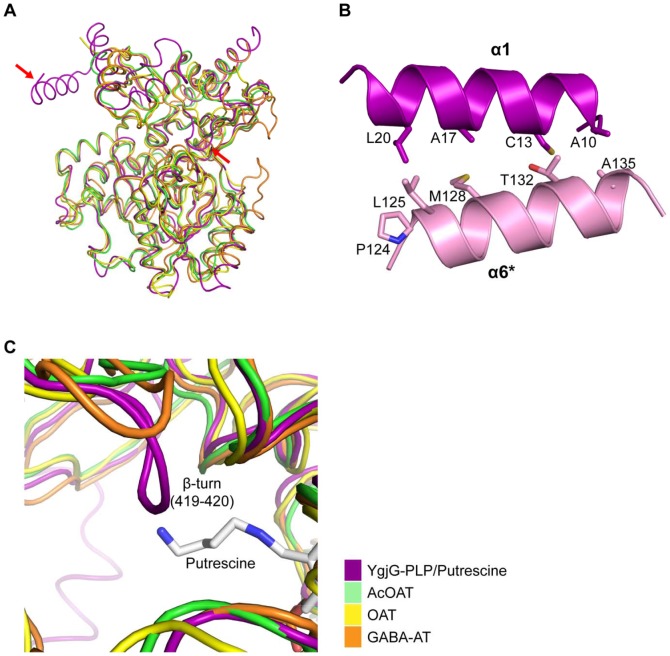
Figure 5. Comparison of YgjG and its structural homologs.
(A) Superposition of the Cα trace for the YgjG monomer (magenta) with traces for AcOAT (green, PDB code 1VEF), OAT (yellow, PDB code 2OAT) and GABA-AT (orange, PDB code 1SFF). (B) Ribbon diagram of α-helix (α1) (magenta) and α-helix (α6) of the adjacent subunit (pink) in YgjG. Side chains of residues are shown in stick representation and are labeled. (C) When the YgjG Cα trace was superposed onto the AcOAT, OAT and GABA traces, the tight turn (residues 419–420) in YgjG protruded into the active-site cleft in contrast to its homologs. The Cα traces for YgjG and its structural homologs are colored as in Figure 3A.

