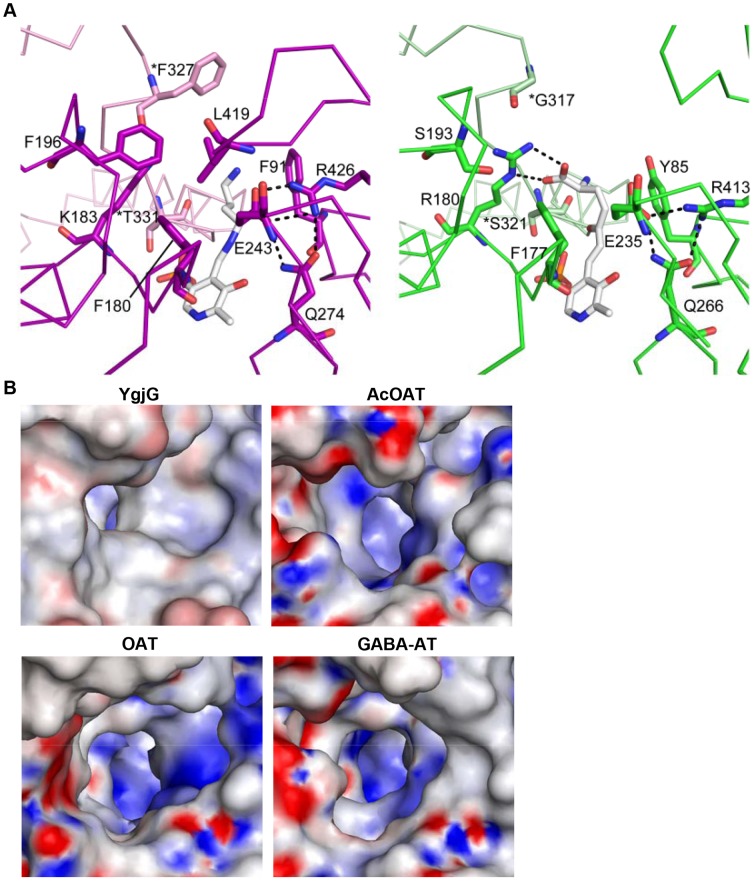
Figure 6. Comparison of substrate-binding sites.
(A) Comparison of the substrate-binding sites in YgjG (in magenta) and OAT (green). The substrate-binding site of YgjG was in complex with the covalent adduct of PLP and putrescine. The substrate-binding site of OAT was in complex with a bound cofactor-inhibitor adduct (FMP). The PLP-putrescine adduct and FMP are shown as a stick model. Potential hydrogen bonds are shown as dashed lines. (B) Electrostatic potential surface representations of the substrate-binding site entrance in YgjG and its homologs. The YgjG entrance region is more hydrophobic than in AcOAT, OAT and GABA-AT.

