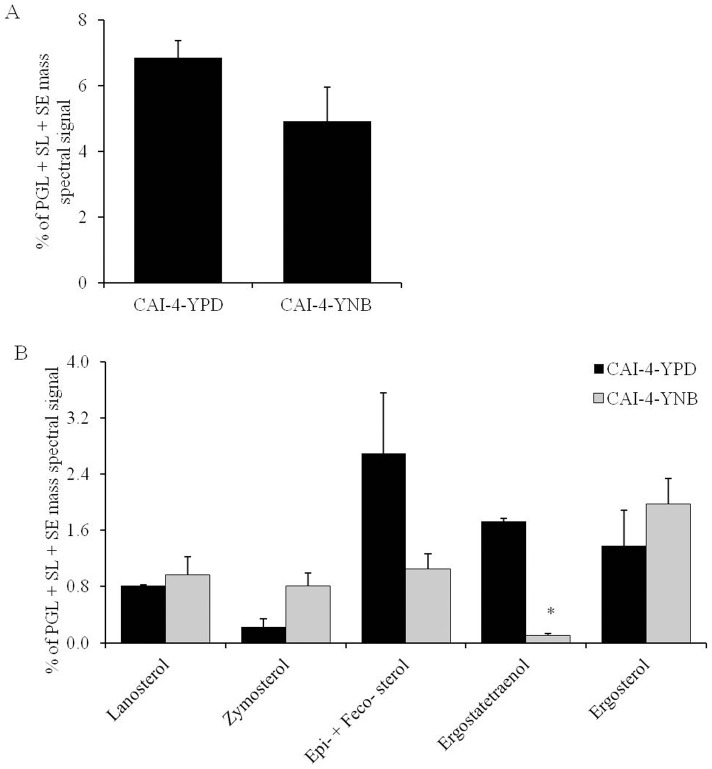
Figure 3. Sterol composition of C. albicans cells grown in YPD or YNB.
A) Total SEs (as normalized total PGL+SL+SE mass spectral signal). B) Relative abundance of SE classes (as % of normalized total PGL+SL+SE mass spectral signal). Values are mean of 2 independent analyses (n = 2). Data can be found in Supplementary Sheet S1. “*” indicates that p-value is <0.05.

