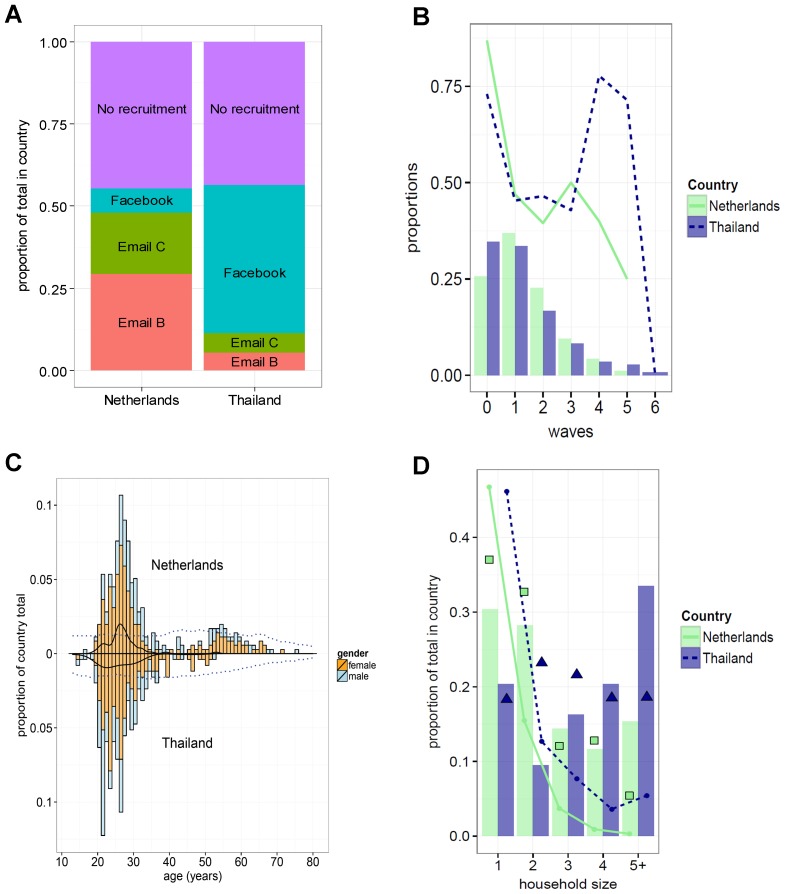
Figure 2. Characteristics of study participants and recruitment.
(A) Recruitment options used by participants. (B) Distribution of participants over waves (in proportions of country totals). The lines indicate the proportion of participants, in each wave, who also invited recruitees (these participants requested four invitations on the last page of the survey). In both countries the proportion of seeds (wave 0) that invited recruitees was more than 70%, and on average more than half of all participants invited one or more recruitees. (C) The age distributions in each country for all participants, with colour indicating sex. The solid lines (black) display the age distributions for seeds only. The blue dotted lines show the estimated Dutch and Thai population estimates for 2012. (D) The household sizes reported by participants in each country (bars). The squares (for the Netherlands) and triangles (Thailand) show the household sizes as reported by the national census bureaus. The lines in the graph indicate the number of household members with one or more symptoms (as a proportion of the country totals), as reported by participants (30 participants in the Netherlands did not known whether household members had any symptoms, compared to 20 in Thailand).

