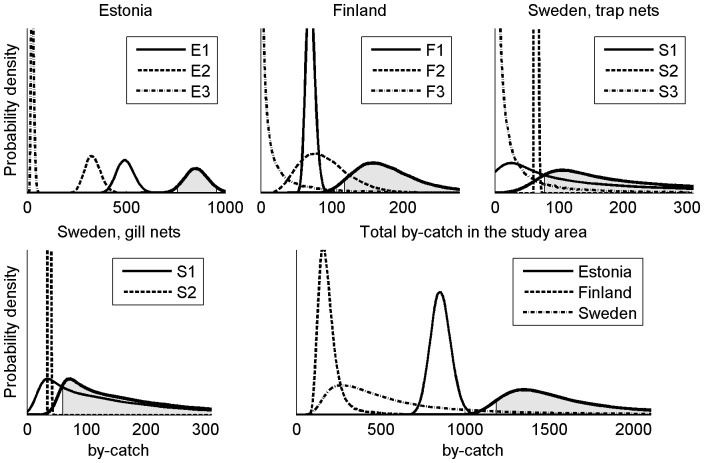
Figure 2. The posterior distributions of the by-catch.
In the country specific panels, the lines without fill represent by-catches in sub-areas and the line with grey fill represents the total by-catch in a country. In the total by-catch panel, the lines without fill represent the country-specific by-catches (filled lines in country panels) and the line with fill represents the total by-catch in the Baltic Sea. The grey shaded area is the central 90% credible interval.

