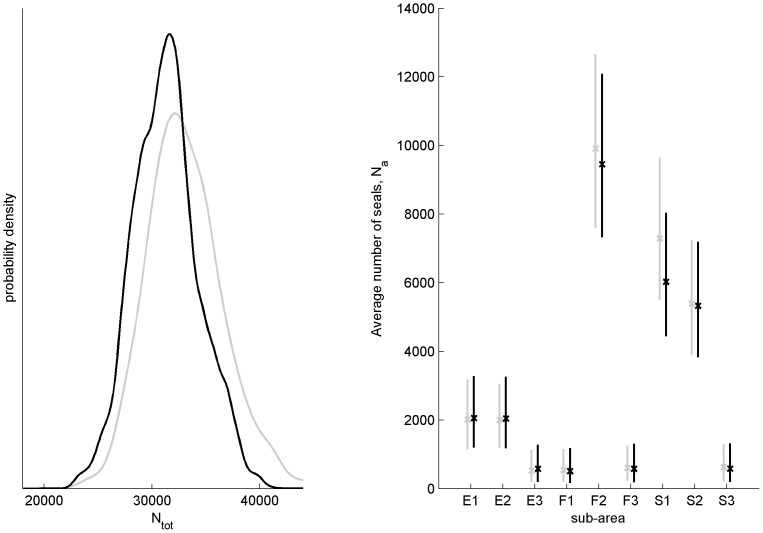
Figure 4. On the left, the posterior (black) and prior (grey) distribution of the number of seals that have survived other mortality sources than by-catch.
On the right, the posterior (black) and prior (grey) median (cross) and central 90% credible interval of the average number of seals in sub-areas.

