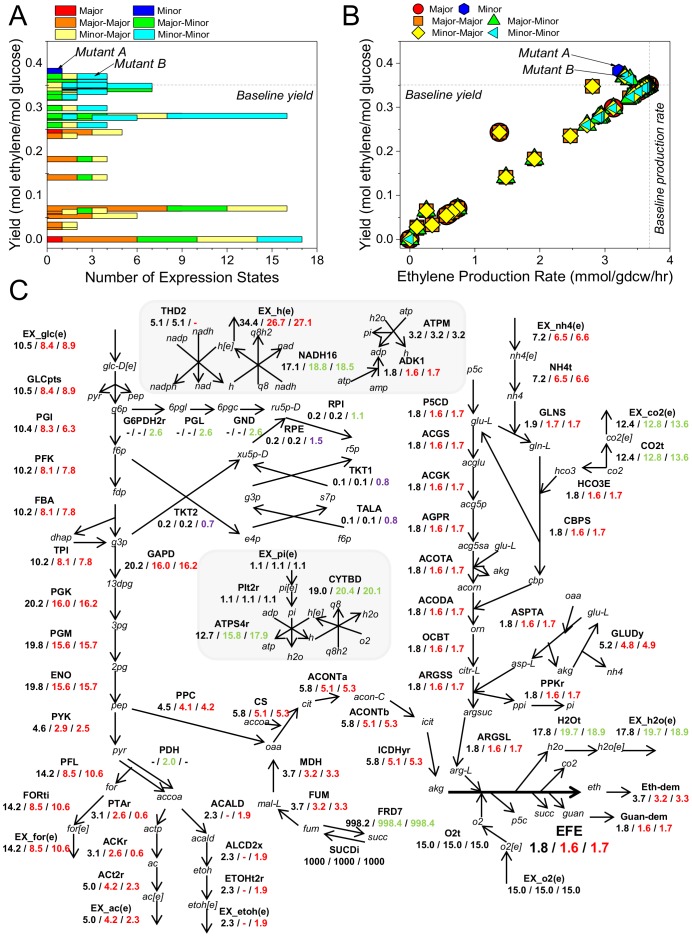
Figure 2. Constrictor Study on Individual Reactions.
(A) The ethylene yields for each expression state (relative to baseline) are shown on the vertical axis, and the corresponding number of the expression states is shown on the horizontal axis. Expression states are indicated in the legend. “Major” and “Minor” represent modifications to the upper bound of irreversible reactions. Other expression states (e.g. “Major-Major”) describe the modifications to lower and upper bounds of reversible reactions, respectively. (B) The solutions obtained from targeting each active reaction are plotted according to their yield and production rate. Horizontal and vertical lines indicate baseline yield and baseline production rate, respectively. (C) Metabolic pathway map comparing flux of metabolic reactions (mmol/gdcw/hr) between the baseline case and mutants A and B (baseline/mutant A/mutant B). Red, green and black text indicates that the magnitude of flux in the mutant is lower, higher, and equal to the baseline flux, respectively. Purple text indicates that the direction of the reaction is opposite to the baseline case.

