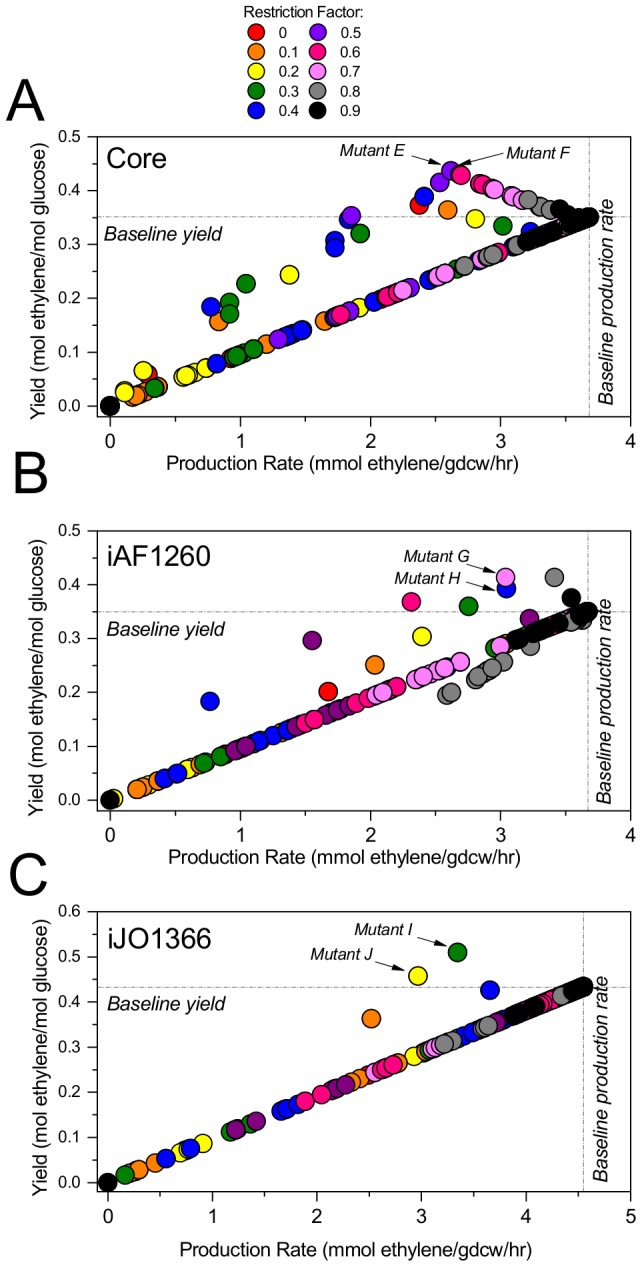
Figure 3. Tuning expression of individual reactions in the core model (A), the genome scale models iAF1260 (B) and iJO1366 (C).

Constrictor was used to reduce each reaction individually by each of the restriction factors indicated in the legend, where each factor is a fraction of the baseline flux. Each point represents the ethylene yield and production rate of one Constrictor solution.
