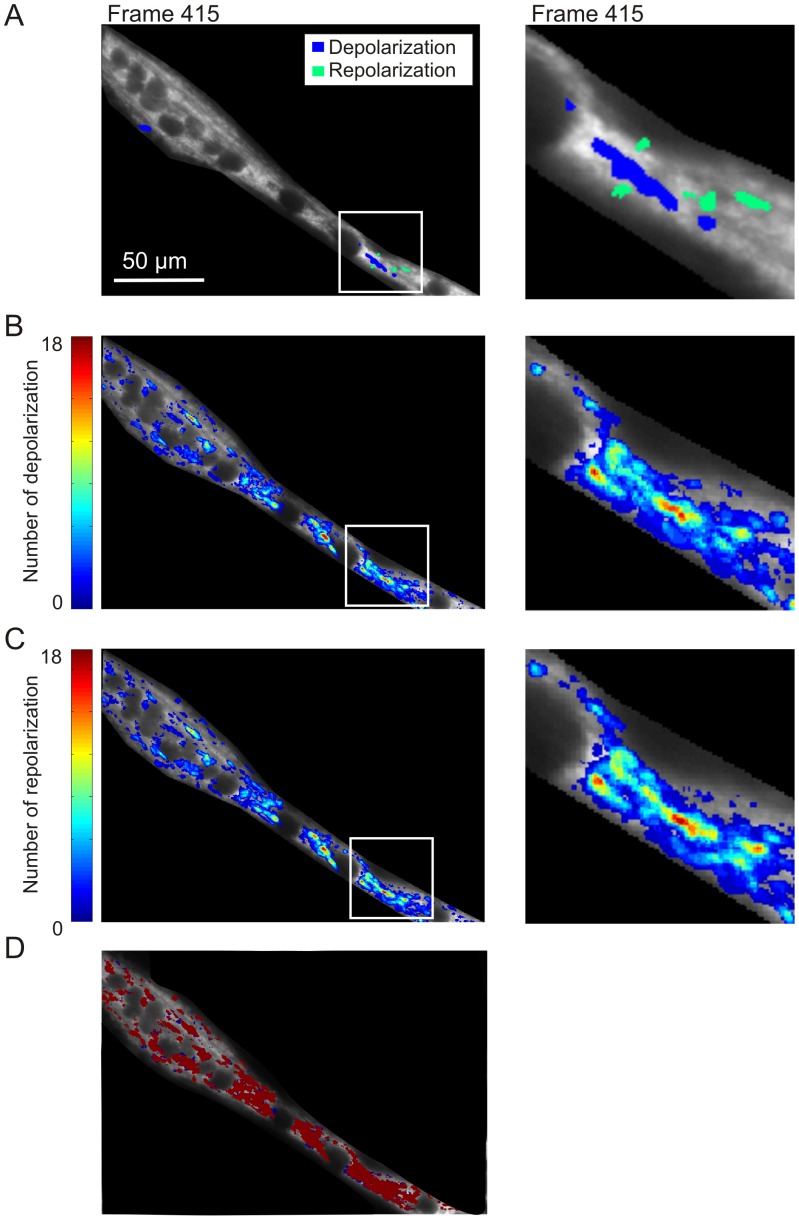
Figure 6. Spatiotemporal properties of ΔΨ flickering in primary mouse myotubes.
(A) Typical image of a TMRM-stained myotube (left panel). (B) Image obtained by summing all images within the DEP stack, reflecting the total number and position of the ΔΨ depolarizations (left panel). The image was color coded based upon the number of depolarizations. (C) Similar to B but now using the REP stack to reflect the total number and position of the ΔΨ repolarizations. The rectangle in A, B, and C indicates the region of interest (ROI) magnified in the corresponding panels to the right. D) Co-localization of the ΔΨ depolarizations and repolarizations observed in panel B and C. See results for details.

