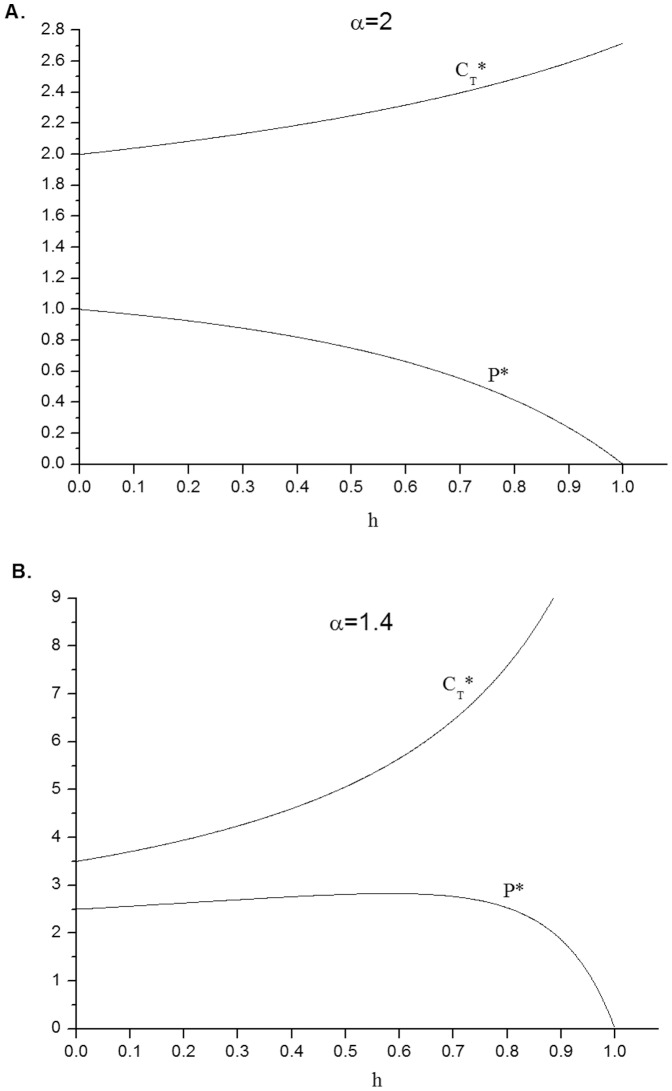
Figure 1. The optimal monopolistic drug price, P*, and the lower consumption threshold above which patients will purchase the drug,  , as a function of the relative health improvement, h (the lower h, the greater the health improvement).
 is always increasing in h (see proof in footnote 7), i.e. the more dramatic the health improvement offered by the drug, the lower
  , and the larger the proportion of patients who will use the drug. For typical values of
  , the consumption distribution Pareto exponent, P* is monotonically decreasing in h, i.e. the more dramatic the health improvement the higher the drug price, as typically found empirically (see panel A). For low values of
  , P* may decrease with h over some range (see panel B).

