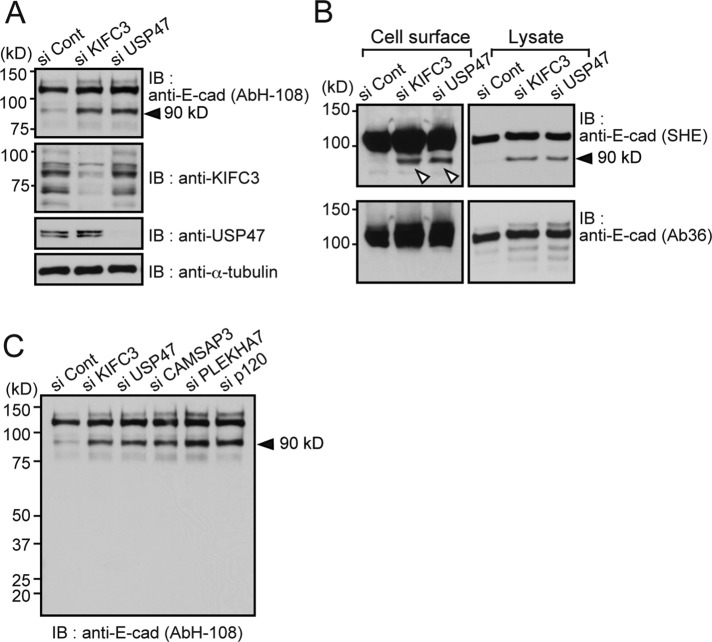
FIGURE 3:
Generating a 90-kDa E-cadherin fragment by KIFC3 or USP47 depletion. (A) Western blot detection of E-cadherin using AbH-108 after KIFC3 or USP47 depletion. Levels of KIFC3 or USP47 in respective samples are also shown. α-Tubulin was used as a loading control. Black arrowheads point to the 90-kDa E-cadherin fragment. (B) Detection of 90-kDa fragments from cell surface protein–biotinylated samples. Left, isolated biotinylated proteins were subjected to Western blotting, from which E-cadherin was detected using antibodies recognizing its extracellular (SHE78-7 [SHE]) or intracellular (Ab36) region. Only SHE78-7 detects the 90-kDa band (white triangles). Right, total cell lysates. Lower kilodalton bands, detected by Ab36, do not correspond to the 90-kDa band, as assessed by close comparisons of their positions. (C) Effects of CAMSAP3, PLEKHA7, and p120-catenin knockdown on production of the 90-kDa fragment.

