FIGURE 3:
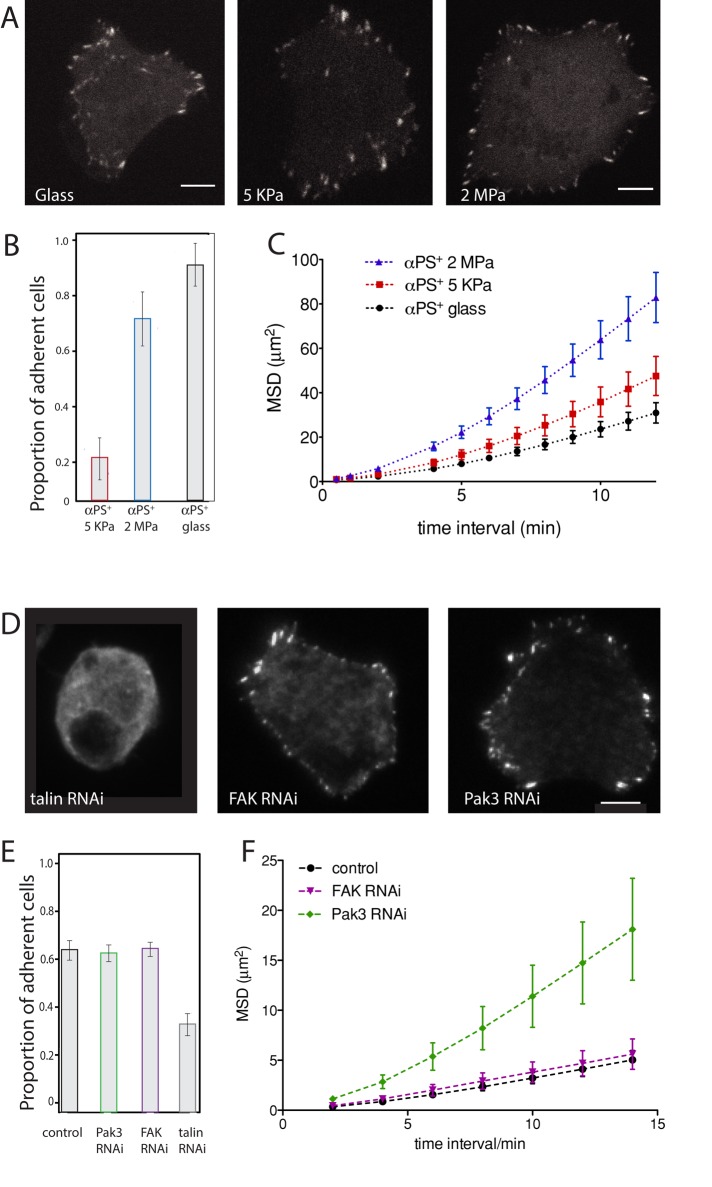
Response of FA to stiffness changes and effect of protein depletion on adhesion and motility. (A) Drosophila S2 cells expressing α-integrin (α-PS+) were plated on vitronectin-coated PDMS substrates of three different rigidities (glass, 5 KPa, or 2MPa). Scale bars: 5 μm). (B) The percentage of adherent cells was scored after a 1-h plating time, cell fixation, and Alexa Fluor 548–phalloidin staining. Two independent experiments were conducted, and in each experiment, 10 fields of view were imaged on a spinning-disk microscope (>100 cells counted per condition from two experiments). Bars indicates the confidence interval (of the binomial proportion) computed with the Pearson-Klopper method. (C) Cell movement was assayed on the different surfaces for 3 h. Graphs represent movement of the centroids of >30 cells from two experiments. (For plots of each condition with single-cell trajectories see Supplemental Figure 1.) (D) FA after talin, FAK, and Pak3 RNAi treatment. (E) Proportion of adherent vs. nonadherent cells after RNAi depletion of the talin, FAK, and Pak3. Cells were plated after 5 d of the RNAi treatment on a functionalized glass surface, images were acquired with a spinning-disk confocal microscope (>150 cells from two (talin RNAi) or three experiments). Bars indicate the 95% confidence interval (of the binomial proportion) computed with the Pearson-Klopper method. The t test is significantly different for talin-depleted cells compared with all other conditions (p < 0.05). (F) MSD of control and depleted cells, quantified using cell centroid trajectory over 3 h (>30 cells from three experiments).

