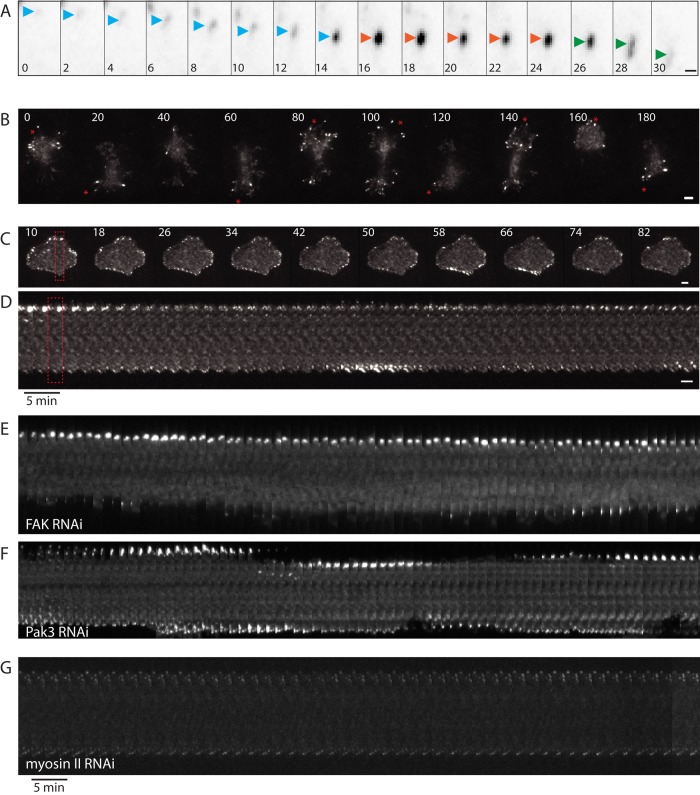
FIGURE 4:
Cells expressing integrin have different motility behaviors. Focal adhesion dynamic behavior requires FA maturation. (A) Example of a focal adhesion (labeled with p130Cas-GFP) turnover in α-PS+ cell plated on vitronectin: assembly (increasing intensity, blue arrowhead), maturation (constant intensity, red arrowhead), and disassembly (decreasing intensity, green arrowhead). Time: min; scale bar: 1 μm. (B and C) Still images from a time-lapse sequence of an α-PS+ cell showing motility (B) and an α-PS+ cell that is stationary (C) show clusters of FA appearing and disappearing in a synchronous manner at the perimeter (Supplemental Movie 1 and 2 correspond to the stills shown). Time: min; scale bar: 5 μm. (D) Kymograph of a cell slice (red dashed rectangle in C) shows the appearance and disappearance of FA at the bottom and top of the cell in an out-of-phase manner. (E–G) Kymograph of representative cell slices after FAK (E), Pak3 (F), and myosin II heavy-chain (G) depletion showing focal adhesion dynamics at opposite sides of a cell (see Figure 4D for more details). Scale bar: 5 μm.

