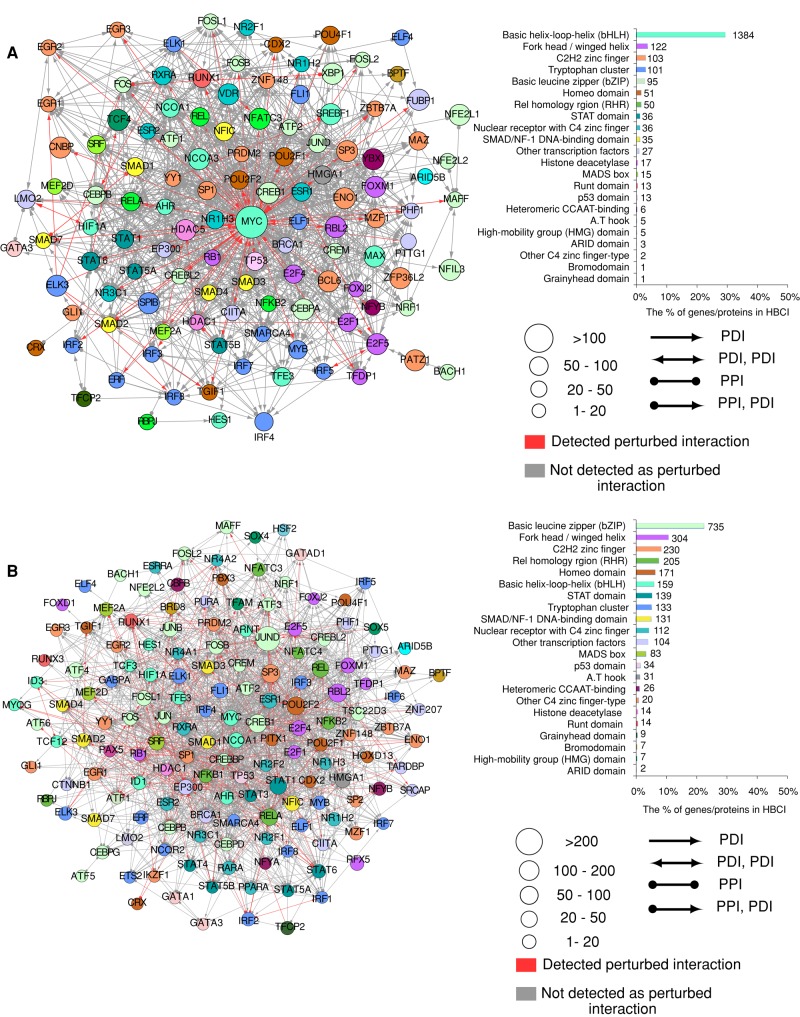
FIGURE 5:
Network of TFs in (A) ETV6-RUNX1 and (B) TCF3-PBX1 fusion. Left, circles represent TFs that have at least one protein–DNA interaction (PDI) predicted as perturbed; colors correspond to the class of transcription factor. Red/gray edges represent the perturbed/not-perturbed interactions, respectively. Right, chart showing the number of perturbed interactions for each transcription factor class according to TF class (Wingender et al., 2013).

