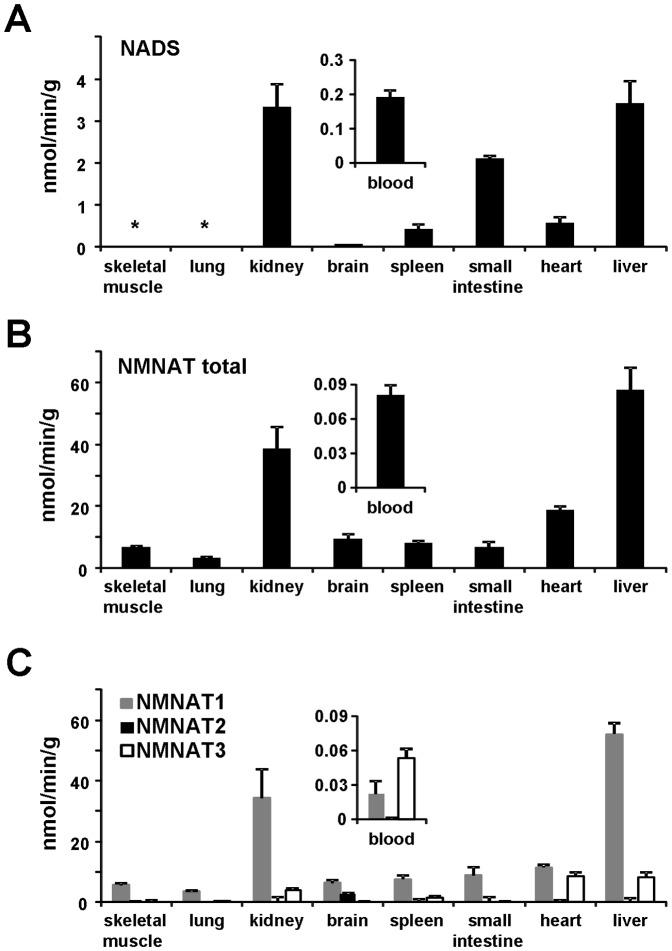
Figure 3. In vitro activity profiling of NMNAT and NADS in mouse tissues.
A, NADS activity; B, total NMNAT activity; C, isozyme-specific NMNAT activity. Insets show in an amplified scale the activity profile of whole blood. Rates were measured at a saturating concentration of all substrates, and represent the mean ± standard error from at least duplicate analysis. (*) not detectable (i.e., ≤0.005).

