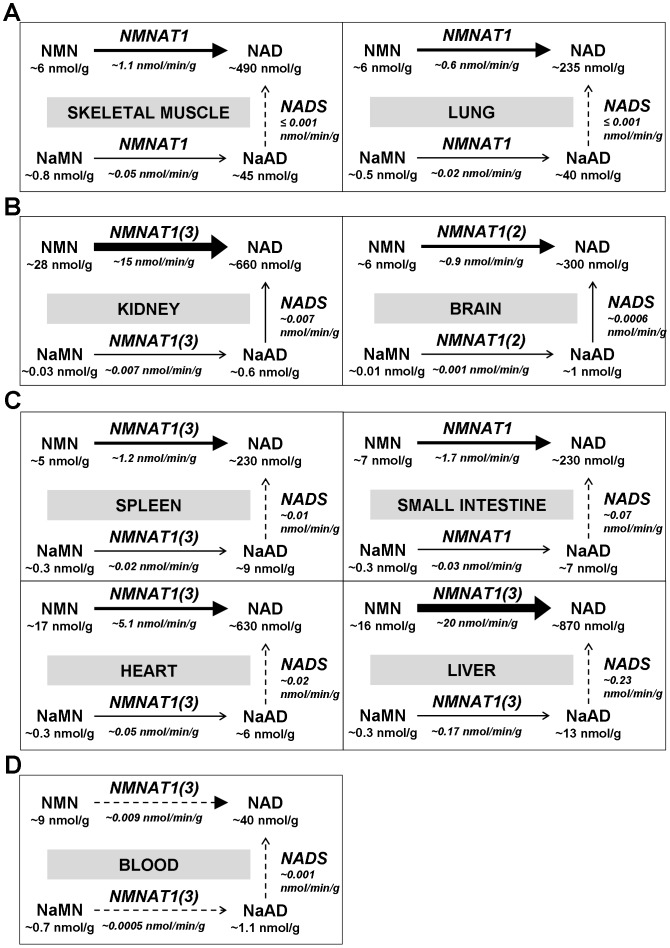
Figure 6. Metabolic reconstruction of the NAD biosynthesis rate in mouse tissues.
The nine tissues analyzed are clustered in four distinct groups (panels A, B, C, D). Only the NMNAT and NADS steps of the pathway are shown, together with the steady-state levels of their pyridine reactants (data are taken from Figure 4, Table 2, and Table 3). The in vivo rates of NMNAT isozymes were individually estimated, but here only the total rate is indicated, and the predominant and secondary (within brackets) isozyme species is highlighted in each tissue. Dotted arrows indicate the reactions whose physiological reaction quotients fall most prominently below the thermodynamic equilibrium constant (Table 1).

