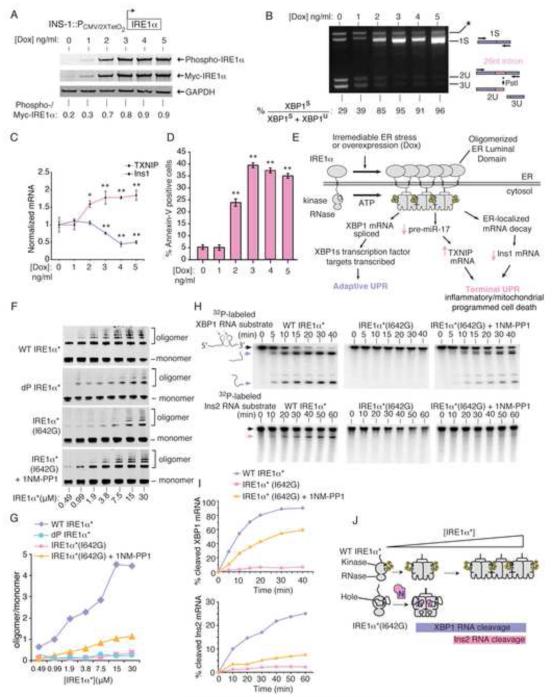
Figure 1. IRE1α’s kinase uses homo-oligomerization as a rheostat to control RNase activity and apoptosis.
(A) Anti-phospho-IRE1α and anti-Myc immunoblots (ratiometric quantitation, normalized to GAPDH). (B) Agarose gel of PstI-digested XBP1 cDNA amplicons (ratiometric quantitation of spliced to total XBP1 cDNAs). (C) Q-PCR for Insulin1 (Ins1) and TXNIP mRNAs. (D) %Annexin-V positive staining. (A-C) utilized INS-1::IRE1α (WT) cells under increasing [Dox] at 24hr, whereas (D) is at 72 hr. (E) Model of how IRE1α promotes both adaptive and apoptotic outputs. (F) Immunoblots of increasing concentrations of IRE1α*(WT), dP-IRE1α*(WT), and IRE1α*(I642G) −/+ 1NM-PP1 (10 μM) followed by disuccinimidyl suberate (DSS) (250 μM) crosslinking, with oligomer/monomer quantification (G). (H) Time course urea PAGE of cleavage of α32P-labeled XBP1 RNA and Insulin2 (Ins2) RNA by IRE1α*(WT) and IRE1α*(I642G) −/+ 1NM-PP1 (10 μM), with quantification (I). (J) Model of oligomerization-dependence of RNase activity against XBP1 and Ins2 RNAs by IRE1α*(WT) and IRE1α*(I642G). Three independent biological samples were used for XBP1 splicing, Q-PCR and Annexin V experiments. Data plotted as mean value ± SD. P-values: *<0.05 and ** <0.01, ns=not significant. Also see Figure S1.

